S&P 500 Performance and Risk Appetite Indicator

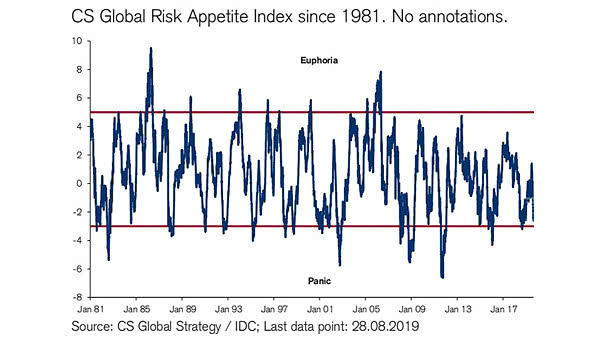
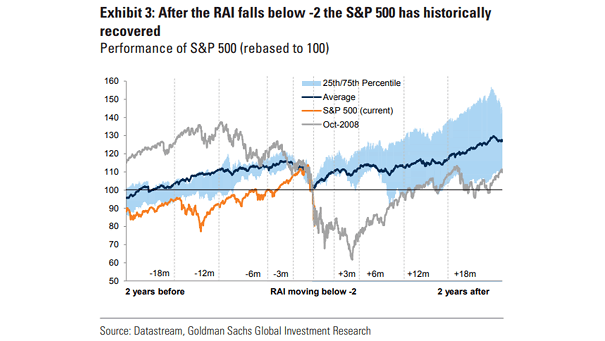
S&P 500 Performance and Risk Appetite Indicator This chart suggests that the S&P 500 has historically recovered, after the Risk Appetite Indicator falls below -2. Image: Goldman Sachs Global Investment Research

CS Global Risk Appetite Index

CS Global Risk Appetite Index The Credit Suisse Global Risk Appetite Index falls, but is not at panic level. Image: Credit Suisse

Global Risk Sentiment Indicators

Global Risk Sentiment Indicators Sentiment indicators suggest a “Goldilocks” scenario for risk appetite—investors are cautiously optimistic, but not exuberant or fearful. Image: TS Lombard

FMS Investors – Net % Taking Higher than Normal Risk Levels

FMS Investors – Net % Taking Higher than Normal Risk Levels In September, FMS risk appetite has significantly decreased, reaching a 11-month low. This decline reflects growing concerns among FMS investors regarding economic stability and market conditions. Image: BofA Global Fund Manager Survey

Sentiment – Global Risk Demand Index

Sentiment – Global Risk Demand Index The Morgan Stanley Global Risk Demand Index indicates that investors’ risk appetite is very low, which can often be seen as a contrarian indicator, where extreme pessimism might signal a potential rebound in equity markets. Image: Morgan Stanley

U.S. Stocks Relative to Bonds

U.S. Stocks Relative to Bonds U.S. stocks are at their strongest relative to bonds since Trump’s inauguration, supported by persistent risk appetite and the perception of U.S. market resilience amid global uncertainty. Image: Bloomberg

Bitcoin Price

Bitcoin Price Bitcoin is approaching $100,000, marking a strong recovery after its February 2025 peak. The rally is driven by robust inflows into spot Bitcoin ETFs, renewed risk appetite among investors, and positive sentiment in global markets. Image: Bloomberg

S&P 500 – Margin Debt Expansion vs. Contraction

S&P 500 – Margin Debt Expansion vs. Contraction A decline in margin debt has historically signaled impending market turbulence, as margin debt levels often reflect investor confidence and risk appetite. Image: Topdown Charts

S&P 500 and 12-Month Rate of Change in Margin Debt

S&P 500 and 12-Month Rate of Change in Margin Debt The rise in margin debt in June and July can be seen as a bullish signal for U.S. equities, indicating increased optimism and risk appetite among investors. Image: BofA Global Research Click the Image to Enlarge