Leading Economic Index (LEI) and Fed Funds Rate
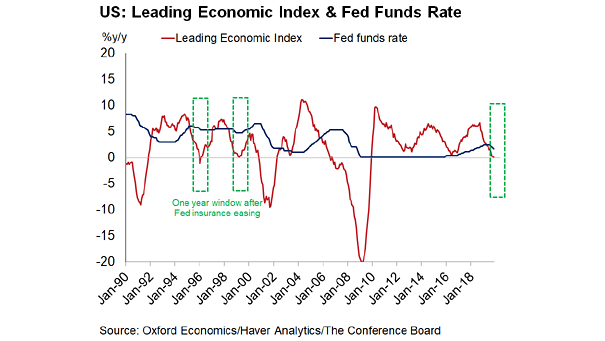
Leading Economic Index (LEI) and Fed Funds Rate Will the Fed’s three rate cuts be enough to lift the U.S. economy? Image: Oxford Economics
Leading Economic Index (LEI) and Fed Funds Rate Will the Fed’s three rate cuts be enough to lift the U.S. economy? Image: Oxford Economics
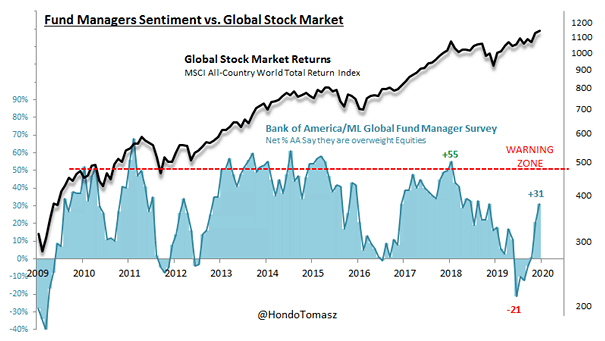
BofA Fund Managers Sentiment vs. MSCI ACWI TR Fund managers are euphoric about the future state of the global economy, but the chart suggests that the euphoria has not yet reached the warning zone. Image: Tomasz Hońdo

China Manufacturing PMI and Global Manufacturing PMI Chart suggesting that the global economy should avoid recession and a moderate global recovery is expected in 2020. Image: Danske Research
Average Age of U.S. Private Fixed Assets Since the Great Financial Crisis, America’s equipment is getting older. Companies have been reluctant to invest and that’s not good news for the U.S. economy. Image: Deutsche Bank Global Research
U.S. Corporate Profits vs. S&P 500 EPS The current divergence between large-cap profits and the rest of the economy is the widest on record. It is possible to close the gap “down” (recession) or “up” (reflation). Image: BofA Global Research
Volatility of U.S. GDP Growth, Inflation and Unemployment Rates Interesting chart showing the decline in volatility of the U.S. economy that occurred in the 1980s. Image: Goldman Sachs Global Investment Research
Consumer Spending Contribution to U.S. GDP Consumer spending, which accounts for about 70% of the U.S. economy, is driving GDP growth solo. Image: Oxford Economics
Share of World GDP U.S. consumption alone accounts for around 17% of word GDP, a larger share than the entire Chinese economy. Image: Deutsche Bank Global Research
U.S. Debt Growth vs. Real GDP Growth Chart showing that the United States is on an unsustainable path, because U.S. debt is growing faster than the economy. Image: Real Investment Advice
U.S. Buybacks – Quarterly Share Repurchases by S&P 500 Companies CEOs are worried about the economy and U.S. companies are spending less on stock buybacks, amid the trade war. Image: Financial Times
U.S. Small Business Sales Expectations and Nominal U.S. GDP Growth Chart showing the correlation between U.S. small business sales expectations and nominal U.S. GDP growth, and the impact of small businesses to the U.S. economy. Image: Blackstone