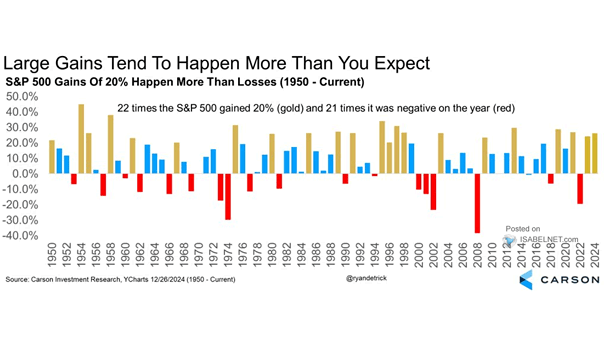
Bubble – Wilshire 5000 to Nominal GDP Ratio
Bubble – Wilshire 5000 to Nominal GDP Ratio The ratio of market capitalization to GDP is now higher than it was before the Internet bubble burst. Is the U.S. stock market on a bubble? Image: Statista
Secular Bull Market Analogs and S&P 500 U.S. stocks have behaved like a secular bull market since the Great Recession. Image: BofA Global Research
EPS Growth – Political Party and S&P 500 Profits Cycle Historically, S&P 500 volatility has increased ahead of U.S. elections, but at the end of the day, “profits matter more than politics.” Image: BofA US Equity & US Quant Strategy
WTI Crude Oil vs. S&P 500 Energy Index U.S. energy stocks continue to trade at low levels relative to crude oil prices. Image: Morgan Stanley Wealth Management
Apple Market Capitalization vs. Russell 2000 This charts shows how big Apple is compared to U.S. small cap stocks. Image: Societe Generale Cross Asset Research
Bank to IG Index Spread Ratio and Bank to S&P 500 Ratio Are U.S. bank stocks a buying opportunity, despite Warren Buffett’s selloff? Image: Goldman Sachs Global Investment Research
Returns – S&P 500 Is on Pace for Its Fifth Consecutive Month of Gains Does the U.S. stock market rally have more legs, even though valuations are high? Image: Bloomberg
Fed Funds Futures Curve (Interest Rates) For the first time, traders are starting to price in negative U.S. interest rates for first time. Image: The Daily Shot
Global Real GDP vs. Nominal Broad Dollar TWI The U.S. dollar tends to weaken when global growth picks up. Image: Goldman Sachs Global Investment Research
Conference Board Consumer Confidence U.S. consumer confidence falls in August, as more and more companies announce layoffs. Image: The Daily Shot