The Santa Claus Rally – S&P 500 Index Returns
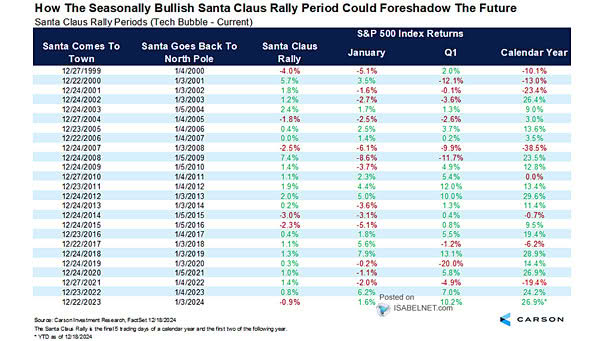
The Santa Claus Rally – S&P 500 Index Returns Historically, a bullish Santa Claus rally has tended to lead to strength for January and the full year, often leaving investors as giddy as a kid on Christmas Day! Image: Carson Investment Research