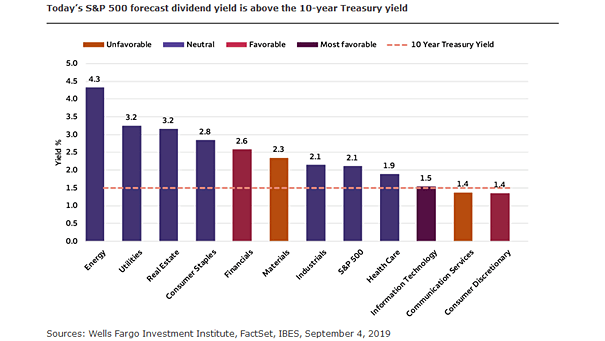
The Fed’s Treasury Holdings by Maturity

The Fed’s Treasury Holdings by Maturity Nice chart showing the Fed’s Treasury holdings by maturity before and after the financial crisis. Image: Reuters

Demographics and U.S. 10-year Treasury Yield

Demographics and U.S. 10-year Treasury Yield The trend in global savings has turned. The chart suggests that the dis-saving phase is likely to be inflationary. Image: Gavekal, Macrobond

S&P 500 Dividend Yield and 30-Year Treasury Bond

S&P 500 Dividend Yield and 30-Year Treasury Bond Are U.S. equities a “buy”? The dividend yield of the S&P 500 Index is now higher than the yield from a 30-year Treasury bond. This is a rare phenomenon. But the equity risk does not disappear because a company pays a dividend. Image: Bloomberg

The Fed vs. the 10-Year Treasury Yield

The Fed vs. the 10-Year Treasury Yield The Fed fund curve suggests that the 10-year Treasury yield could fall below its all-time low of 1.32% in 2016. Image: Fidelity Investments

MOVE vs. Treasury Term Premium

MOVE vs. Treasury Term Premium This chart shows the nice correlation between MOVE (implied volatility of U.S. Treasury markets) and the Treasury term premium. The term premium is the risk premium (or the bonus) that investors receive for the risk of owning longer-term bonds. Image: Longview Economics, Macrobond