U.S. 30-Year Bond Price: Deviation from 200-Day Moving Average
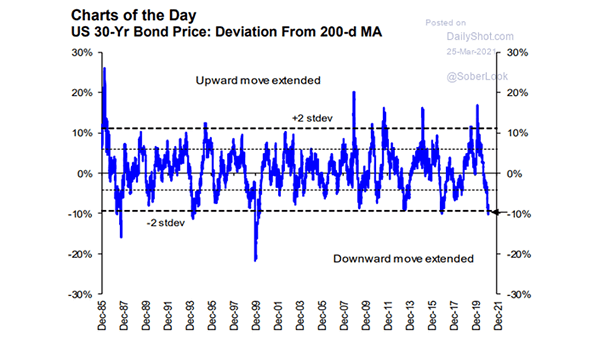
U.S. 30-Year Bond Price: Deviation from 200-Day Moving Average Is it the best time to buy U.S. government bonds? Image: The Daily Shot
U.S. 30-Year Bond Price: Deviation from 200-Day Moving Average Is it the best time to buy U.S. government bonds? Image: The Daily Shot
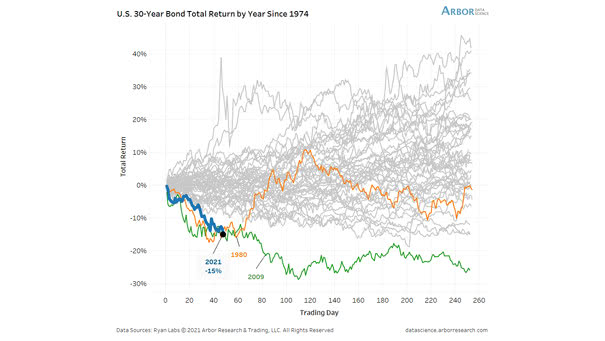
U.S. 30-Year Bond Total Return by Year Since 1974 Will 30-year bond yields keep rising? Image: Arbor Research & Trading LLC

U.S. Inflation Expectation – 30-Year Breakeven Rate Is inflation coming back in the United States? Image: Crescat Capital LLC
U.S. 30-Year Government Bond Yield and Russell 2000 Relative to S&P 500 As the chart suggests, U.S. 30-year yields are likely to increase further. Image: BCA Research
U.S. 30-Year Treasury Yield and Asset Allocation In a low yield environment, does a 40% bond allocation still make sense? Image: BofA Global Investment Strategy
U.S. Housing Market and 30-Year Mortgage Rate Mortgage rates hit new low, contributed to the boom in the U.S. housing market. Image: BCA Research
U.S. 30-Year Mortgage Rates vs. 10-Year U.S. Treasury Yield U.S. 30-year mortgage rates have fallen to record low, but remain elevated relative to the 10-year U.S. Treasury yield. Image: Goldman Sachs Global Investment Research
Yield Curve – Difference 5-Year and 30-Year Treasury Yields The yield curve steepens after the Fed pivot. Are Gold prices at risk? Image: Financial Times
Secular Bull Market – Dow Jones Industrial Average and 30-Year Bond Cycles Chart suggesting a “new” secular bull market underway with the potential to last until 2034. Image: Fundstrat Global Advisors, LLC
U.S. Real Yield Curve and 2-Year/30-Year U.S. Real Yield Curve Economic stress remains as the U.S. real yield curve remains in negative territory. Image: Morgan Stanley Research
MSCI USA Cyclical Sectors-Defensive Sectors Spread USD Index vs. 2-Year/30-Year U.S. Treasury Yield Curve This chart suggests that cyclical outperformance of defensives tends to be correlated with the shape of the 2-year/30-year U.S. Treasury yield curve. Image: Morgan Stanley Research