Euro to U.S. Dollar (EUR/USD) and EMU vs. U.S. Mobility
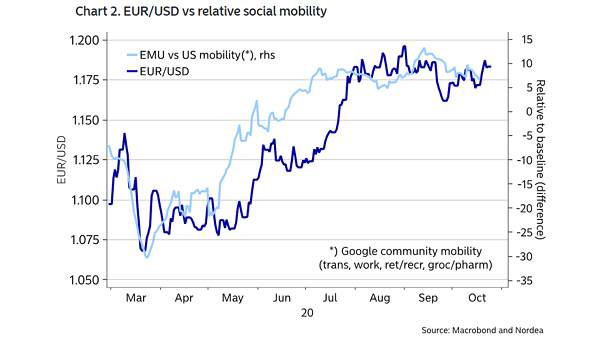
Euro to U.S. Dollar (EUR/USD) and EMU vs. U.S. Mobility EUR/USD could drop further, as lockdowns return to Europe. Image: Nordea and Macrobond
Euro to U.S. Dollar (EUR/USD) and EMU vs. U.S. Mobility EUR/USD could drop further, as lockdowns return to Europe. Image: Nordea and Macrobond
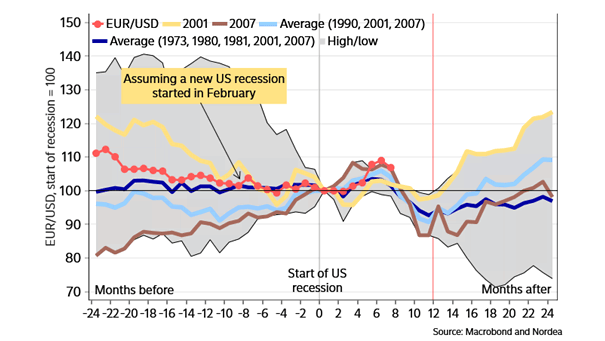
Euro to U.S. Dollar (EUR/USD) Forecast If history repeats itself, the pair EUR/USD could trade lower in 6 months time. Image: Nordea and Macrobond

Euro to U.S. Dollar (EUR/USD) Net speculative positions could suggest that the euro has more downside. Image: BCA Research
EUR/USD and S&P 500 The correlation between the EUR/USD and the S&P 500 is very high. Will August end in storms for markets? Image: Societe Generale Cross Asset Research
U.S. Dollar/Euro (EUR/USD) and Equal-Weighted 10-Year G4 Yields Can the EUR/USD go higher? This chart suggests that 10-year G4 yields need to rise before the EUR/USD can push higher. Image: Nordea and Macrobond
Euro to U.S. Dollar (EUR/USD) and U.S. Dollar to China Yuan (USD/CNY) According to Goldman Sachs, the U.S. dollar remains overvalued despite the recent selloff, and offers poor fundamentals. Image: Goldman Sachs Global Investment Research
S&P 500, Treasury Bond, Global GDP, EUR/USD – Protracted Scenario Projections This table suggests protracted scenario projections. Image: Deutsche Bank Research
Relative Performance of S&P 500 vs. Euro Stoxx 50 and EUR/USD EUR/USD fell to lowest level since May 2017. The growth differential should remain in favor of the US dollar. Image: Pictet Wealth Management
EUR/USD and Euro Area M3 Chart showing the correlation between the euro-area broad money supply (M3) and EUR/USD (inverted). Image: Morgan Stanley Research
U.S. Dollar Liquidity vs. EUR/USD The inflow of U.S. dollar into the financial system should continue to grow this year and tends to support the euro against the US dollar. Image: Saxo Bank
EUR/USD One Year Historical Volatility (U.S. Dollar and Euro) 2019 is a record low volatility in EUR/USD since 1999. Image: Oxford Economics, Macrobond