Valuation – PE10 Ratio: USA vs. Rest of the World

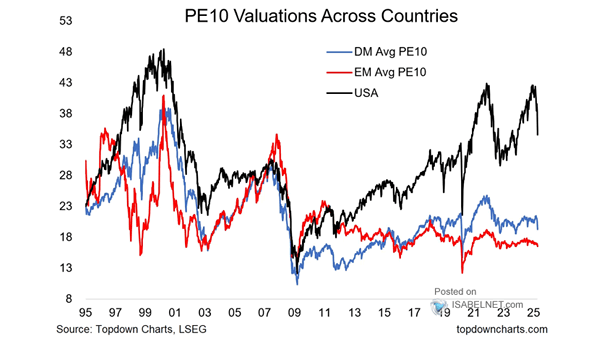
Valuation – PE10 Ratio USA vs. Rest of the World Investors seeking diversification and long-term growth may prefer emerging markets and non-U.S. developed markets over U.S. stocks due to their attractive valuations. Image: Topdown Charts
Performance – Best Performing Asset

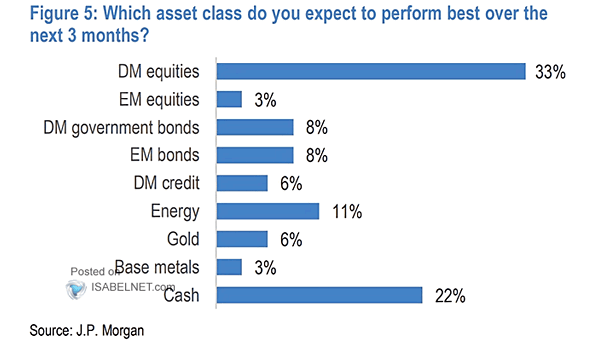
Performance – Best Performing Asset 33% of JPM clients expect developed market equities to perform the best over the next three months, driven by strong economic conditions and favorable market conditions. Image: J.P. Morgan

House Pricing Index

House Pricing Index Rising borrowing costs and interest rates are impacting global housing markets and driving down prices in many developed markets. Image: Morgan Stanley Research

Average and Median Equity Duration

Average and Median Equity Duration U.S. equities are 25% more sensitive to interest rate moves than other developed market equities. Image: Morgan Stanley Wealth Management

EM vs. DM Valuation

EM vs. DM Valuation Emerging market equities look attractive relative to developed market equities. Image: Goldman Sachs Global Investment Research

Asset Return Expections on a Five-Year Horizon

Asset Return Expections on a Five-Year Horizon Government bond returns are expected to be negative across developed markets on a five-year horizon. Source: BlackRock Investment Institute

Sovereign Bonds with Negative Yields

Sovereign Bonds with Negative Yields This chart puts things into perspective by showing the share of developed market sovereign bonds with negative yields (1-10 year maturities). Image: Credit Suisse