China Manufacturing PMI and Global Manufacturing PMI
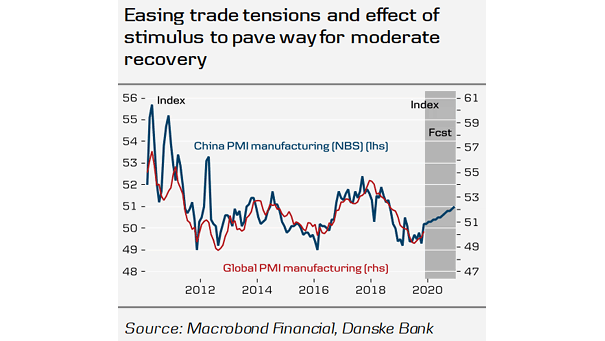
China Manufacturing PMI and Global Manufacturing PMI Chart suggesting that the global economy should avoid recession and a moderate global recovery is expected in 2020. Image: Danske Research
China Manufacturing PMI and Global Manufacturing PMI Chart suggesting that the global economy should avoid recession and a moderate global recovery is expected in 2020. Image: Danske Research
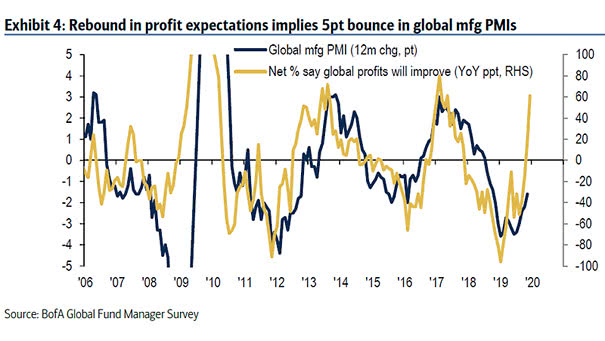
Global Manufacturing PMI and Profit Expectations Rising profit expectations suggest a rebound in the global manufacturing PMI. Image: BofA Global Fund Manager Survey

Average Monthly Return During Global Manufacturing PMI Expansion Phases Since August 15 2019, the rotation performance has been higher than average during global manufacturing PMI expansion phases. Image: Goldman Sachs Global Investment Research
Global Manufacturing PMI Cycle Chart suggesting that the worst is over for global manufacturing PMI. Image: Goldman Sachs Global Investment Research
G7 OECD Composite Lead Indicator and Global Manufacturing PMI This chart also suggests a pick-up in the global manufacturing PMI, after having been in contraction territory. Image: BofA Global Research
JPMorgan Global Manufacturing PMI The JPMorgan Global Manufacturing PMI rises to a seven-month high of 50.3, after having been in contraction territory. NBF Economics and Strategy
OECD LEI Tends to Lead Global Manufacturing PMI by 6 Months Chart suggesting a pick-up in the global manufacturing PMI. Image: Nordea and Macrobond
Global Manufacturing PMI and New Orders/Inventory Global Manufacturing PMI and new orders improved in November. Image: Morgan Stanley Research
Global Equities vs. Global Manufacturing PMI Chart suggesting that market participants expect global manufacturing PMI to rebound strongly. Image: Topdown Charts
OECD Diffusion Index Leads Global Manufacturing PMI Chart suggesting that the OECD diffusion index leads global manufacturing PMI by 6 months. Image: Pictet Asset Management
New Orders to Inventory Ratio Leads Global Manufacturing PMI Chart suggesting that the new orders to inventory ratio leads global manufacturing PMI by 2 months. Image: BofA Merrill Lynch Global Investment Strategy