Historical Changes of U.S. Treasury 10-Year Yield from Troughs
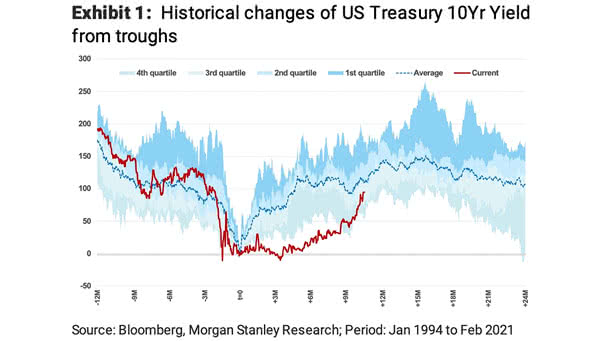
Historical Changes of U.S. Treasury 10-Year Yield from Troughs Will the U.S. 10-year Treasury yield continue to rise? Image: Morgan Stanley Research
Historical Changes of U.S. Treasury 10-Year Yield from Troughs Will the U.S. 10-year Treasury yield continue to rise? Image: Morgan Stanley Research
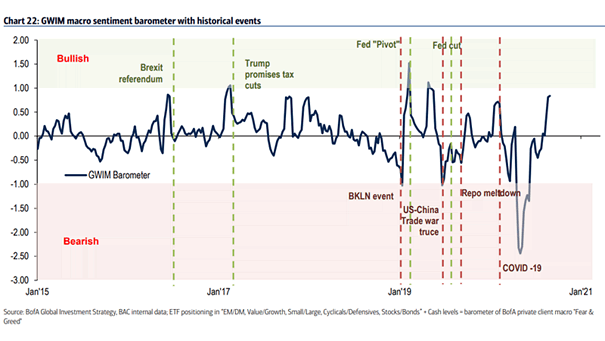
GWIM Macro Sentiment Barometer with Historical Events The GWIM macro sentiment barometer is still moving towards bullish. Image: BofA Global Investment Strategy

S&P 500 Historical Bear Markets and Recoveries since 1929 The all-time high came after a recovery from the shortest bear market in S&P 500 history. Image: Scotiabank GBM Portfolio Strategy
Historical U.S. Unemployment Rate and Forecast Nomura forecasts an unemployment rate of 6% in the United States by the end of 2021. Image: Nomura
U.S. Large Cap Equity Historical Return Decomposition This chart shows the sources of historical returns since 1871. Image: Research Affiliates, LLC
Dow Jones Industrial Average Historical Performance Around Waterfall Declines vs. All Cases Since 2020 The rally since March low is stronger than any of the 13 previous post-waterfall bounces. Image: Ned Davis Research
Dow Jones Industrial Average Historical Performance Around Waterfall Declines vs. 1987 and 2020 The current Dow Jones rally is stronger than the 1987 bounce. Image: Ned Davis Research
Historical Emergency Rate Cuts since 1994 and Stock Market Performance After emergency rate cuts, the table shows that the performance of the S&P 500 has been mixed. Image: LPL Research
Historical EPS Declines during Recession and Historical EPS Rebounds following Recession Historically, S&P 500 EPS fall by 13% from peak to trough and rebound by 15% in the four quarters following recession. Image: Goldman Sachs Global Investment Research
Historical Returns of Stocks and Bonds by Decade The next decade could see anemic returns, due to low growth, low yields and low inflation expectations. Image: Morningstar
EUR/USD One Year Historical Volatility (U.S. Dollar and Euro) 2019 is a record low volatility in EUR/USD since 1999. Image: Oxford Economics, Macrobond