Tech Weight in S&P 500
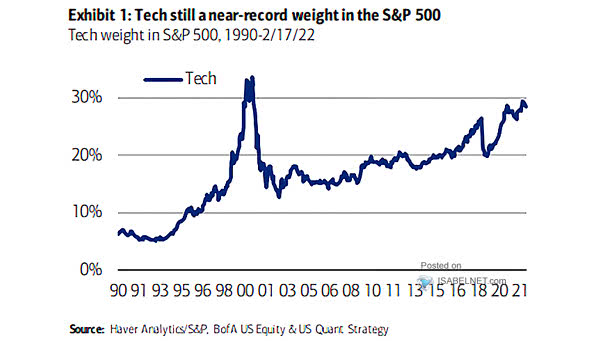
Tech Weight in S&P 500 Tech weight in the S&P 500 is near record high, but fundamentals are much stronger than during the dot-com bubble. Image: BofA US Equity & Quant Strategy
Tech Weight in S&P 500 Tech weight in the S&P 500 is near record high, but fundamentals are much stronger than during the dot-com bubble. Image: BofA US Equity & Quant Strategy
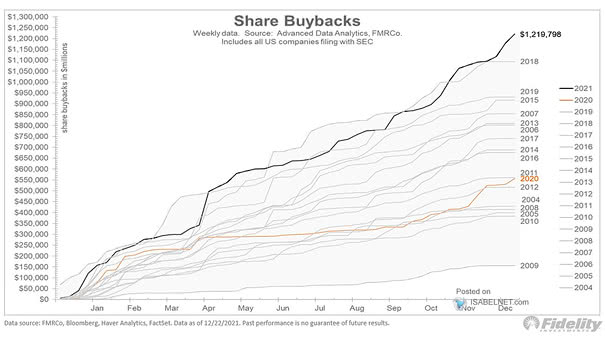
Announced Share Buybacks in the U.S. This chart puts into perspective the year-to-date running total of announced share buybacks in the U.S., Share buybacks surged to record highs this year, which is good news for U.S. stocks. Image: Fidelity Investments

U.S. Job Openings Rate U.S. job openings are near record high, with 11 million open jobs in October, as hiring struggles persist. Image: BofA Global Research
7-Quarter Change in U.S. Household Net Worth The net worth of U.S. households reached a record high of 128% of GDP. Image: BCA Research
S&P 500 Consensus Long-Term Growth Forecast The S&P 500 consensus long-term growth is at record high. Is this a bearish signal? Image: BofA US Equity & Quant Strategy
Equity Allocation of the U.S. Household Sector U.S. households’ equity allocation has risen to record highs. What could go wrong? Image: J.P. Morgan
U.S. Employees on Nonfarm Payrolls and JOLTS Job Openings U.S. job openings hit another record high, as hiring struggles persist. Image: Morgan Stanley Wealth Management
U.S. Households’ Equity Allocation as a % of Total Financial Assets US households’ equity allocation has risen to record highs. What could go wrong? Image: Longview Economics
Treasury Inflation-Protected Securities (TIPS) – ETF Assets Under Management Assets under management in TIPS ETFs surge to record high, as the Federal Reserve lets the U.S. economy run hot. Image: Topdown Charts
Valuation – MSCI ACWI World Market Capitalization to Global GDP Ratio The MSCI ACWI World Market Capitalization to GDP ratio is at record high. Image: Morgan Stanley Research