Global Consumption by Region
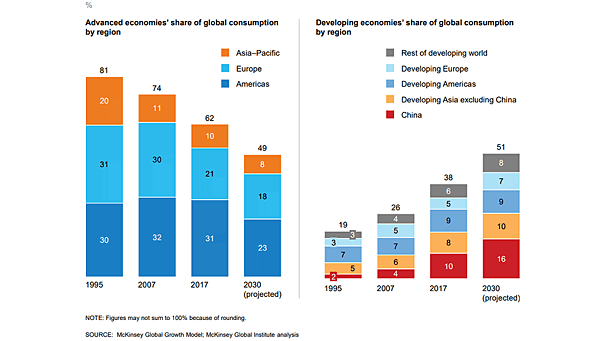
Global Consumption by Region Chart suggesting that developing economies will dominate global consumption. Image: McKinsey Global Institute
Global Consumption by Region Chart suggesting that developing economies will dominate global consumption. Image: McKinsey Global Institute
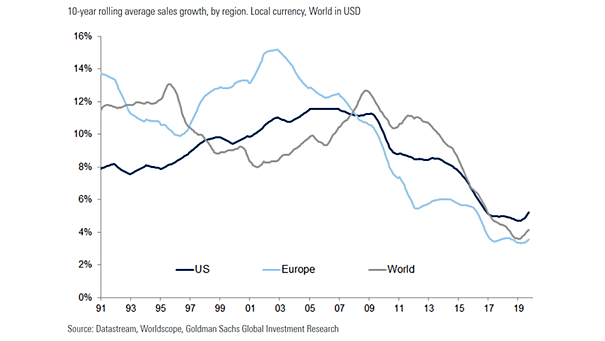
10-Year Rolling Average Sales Growth by Region The importance of remembering the past: this chart shows the steep decline in sales growth over time. Image: Goldman Sachs Global Investment Research

Correlation Between U.S. ISM Manufacturing Index and Regional Indexes This chart shows the quite good correlation between the U.S. ISM Manufacturing Index and regional indexes (Philly Fed, Dallas Fed, Richmond Fed, and NY Empire). Image: Saxo Bank
World Population by Region Projected to 2100 World population is expected to increase to 10.9 billion by 2100 and 83% of the world population will live in Asia and Africa. Image: Our World in Data
Investor Allocation by Region in the U.S. This chart is a good example of investment bias and shows the likelihood of owning stocks in an industry vs. national average. Picture Source: J.P. Morgan Asset Management
S&P 500 Cash Return Yield by Sector and Region Currently, the S&P 500 cash return yield (buybacks + dividends) is 5.2%, the highest since 2011. That’s much more than Europe, Japan and emerging markets. Image: Fundstrat Global Advisors, LLC
WTI Oil Prices While oil prices remain highly sensitive to geopolitical risks, particularly in regions like the Middle East, the market has so far avoided the kind of sustained shock that would trigger broader inflation. Image: Deutsche Bank
Equity Fund Flows U.S. vs. Rest of the World Over the past four weeks, U.S. equity funds have experienced substantial outflows, while equity funds in other regions have recorded inflows, indicating a shift in global investor sentiment. Image: Deutsche Bank Asset Allocation
China Exports China’s exports increased by 2.6% since October 2023, mainly due to demand from regions outside the U.S. However, challenges persist, including weak domestic demand and geopolitical tensions that may impact future trade. Image: BofA Global Investment Strategy
U.S. ISM Manufacturing PMI vs. Philadelphia Fed General Activity vs. U.S. Empire State Manufacturing Survey Regional business activity surveys suggest a lower ISM Manufacturing PMI over the coming months. Image: Morgan Stanley Research
Global Real GDP – Latest World Economic Outlook Growth Projections This table suggests the coronavirus pandemic impact on growth across all regions. Image: International Monetary Fund