U.S. Active vs. Passive Fund Net Flows
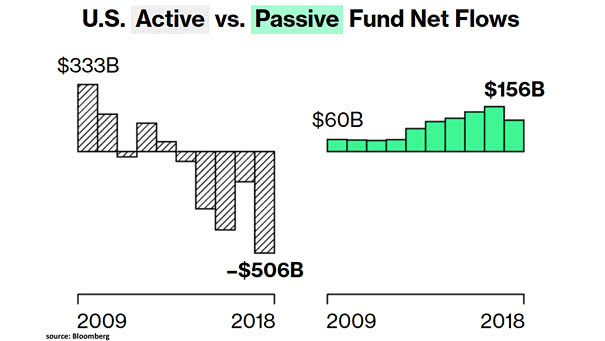
U.S. Active vs. Passive Fund Net Flows Active mutual funds exhibit persistent outflows, while inflows into index-tracking U.S. mutual funds and ETFs continue to rise. Image: Bloomberg
U.S. Active vs. Passive Fund Net Flows Active mutual funds exhibit persistent outflows, while inflows into index-tracking U.S. mutual funds and ETFs continue to rise. Image: Bloomberg
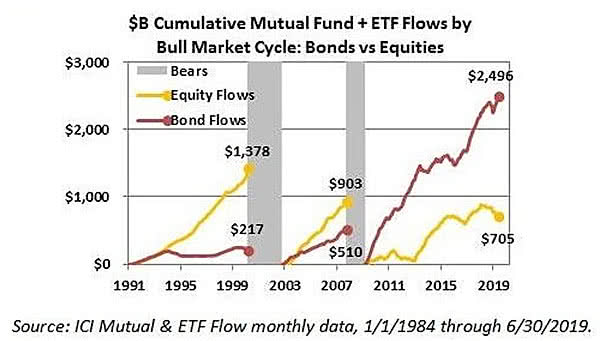
Cumulative Mutual Fund + ETF Flows by Bull Market Cycle: Bonds vs. Equities Flows Is this the most hated bull market in history? Well, investors continue buying bonds. Image: ICI Mutual & ETF Flow

S&P 500 vs. Cumulative Fund Flows “History never repeats itself but it rhymes” said Mark Twain. This chart shows the same trend as for the 2016 period. Image: Topdown Charts
U.S. Bond ETFs Top Inflows Record In June, investors significantly increased their exposure to bond funds, as weak economic data fuels slowdown worries. U.S. bond ETFs inflows hit $25.4bn. Image: Financial Times
Equity Fund Outflows at Record History tell us that equities rose significantly. Image: SunTrust IAG
Global Equity Fund Flows This great chart from Deutsche Bank shows that equity outflows over the last 6 months are now the largest on record. In 2011 and 2016, it was similar and equities rose significantly. Image: Deutsche Bank
Global Equity – Bond Flows According to Bernstein, the S&P 500 not far from its all-time high, could set a new record. Image: Berstein Research
Mutual Fund Flows – Asset Allocation Funds since 2000 Dynamic/flexible and balanced funds saw significant outflows since 2018. It is obvious that many investors don’t have a long-term view. Image: Topdown Charts
Money-Market Funds Flows Over the last 4 weeks, money-market funds have seen a significant inflow of nearly $95 billion. That’s much more larger than in previous years. Image: Deutsche Bank Asset Allocation
US Equity Market Sentiment and Relative ETF Flows Since 2018 This chart shows the correlation between US equity market sentiment and relative ETF flows recently. Inflow to US equity type ETF has picked up recently. Image: Nomura
US Fund Flows 2013-2019 (All Stocks, All Bonds, Mutal Funds and ETFs) Once again, it looks like investors see a recession on the horizon by selling equities and buying bonds. See “The Stock Market Continues to Climb the Wall of Worry” Image: Topdown Charts