S&P 500 All-Time Highs
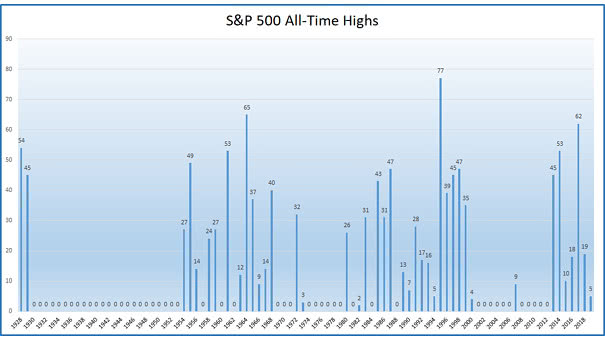
S&P 500 All-Time Highs Great chart showing the 1,140 all-time highs of the S&P 500 since the Second World War. Image: Ryan Detrick, LPL Financial LLC
S&P 500 All-Time Highs Great chart showing the 1,140 all-time highs of the S&P 500 since the Second World War. Image: Ryan Detrick, LPL Financial LLC
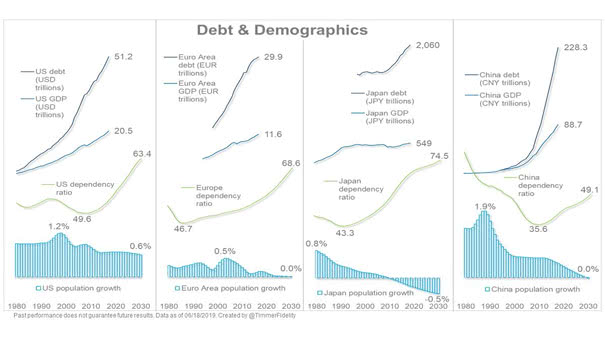
Debt and Demographics Our world is aging with high levels of debt and low interest rates (maybe for a long time). Image: Fidelity Investments

MSCI ACWI ex-U.S. and S&P 500 Index U.S. equities have significantly outperformed the rest of the world in recent years, but this has not always been the case. You may also like “Trailing 12-month Return Differential between U.S. and non-U.S. Stocks.” Image: ClearBridge Investments
The Top 10 Risks to the Global Economy US-China trade conflict, US corporate debt burden, and emerging-markets crisis are the main global risks according to the Economist Intelligence Unit (EIU). Image: World Economic Forum
Total Global Carbon Emissions (CO2) China, the United States, and India account for almost half the world’s carbon emissions. You may also like “Annual Carbon Emissions in Tons.” Image: Visual Capitalist
FED, ECB & BoJ Balance Sheets as Percent of GDP (BoJ leading 10 years) Is this chart the “Japanification” of the world? Image: In Gold We Trust-Report
The Top Wealthiest Countries in 2018 The United States is the world’s largest wealth market with $60.7 trillion in 2018. Inequality: you may also like “Lower Incomes Paid the Highest Price.” Image: Visual Capitalist
How to Double your Money in the Market In this video, Josh Brown, financial advisor at Ritholtz Wealth Management LLC, explains why the power of compounding can help you double your money. You may also like “The Long-Term Impact of Compounded Returns” and why Albert Einstein said “Compound Interest Is the Eighth Wonder of the World.”…
Crude Oil Reserves in Billion Barrels (Gbbl) The proven oil reserves in Venezuela are recognized as the largest in the world, but by some measures, it is the most miserable economy in the world. Image: howmuch.net
What Does Government Debt Look Like Across the Globe? Government debt has risen to over $63 trillion in absolute terms. Japan is the most indebted countries in the world, with debt-to-GDP ratio of 237.6% in 2017. The United States debt-to-GDP ratio is 105.2% in 2017. Image: howmuch.net
“Ken Fisher: Thinking in Ways That Others Do Not, with John Tamny” Great interview of Ken Fisher on: coastal redwoods, dikes and climate change, efficient markets, quantitative easing (QE) vs. inflation, humans as a group are slow to learn, recessions, Fed and interest rates, why philanthropy is bad and immoral, and why inequality is a good…