S&P 500 Annual Return: Dividends, Earnings Growth and Multiple Expansion

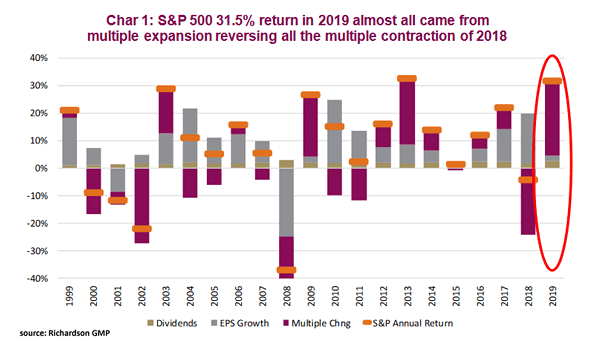
S&P 500 Annual Return: Dividends, Earnings Growth and Multiple Expansion In 2019, the S&P 500 rose 31.5%. 26.9% came from multiple expansion, 2.6% from dividends, and 2.0% from earnings growth. Historically, S&P multiples contract or remain flat following years of big multiple expansion. Image: Richardson Wealth

U.S. Output Gap and Inflation

U.S. Output Gap and Inflation This chart shows that actual U.S. GDP is higher than potential GDP. Historically, a positive output gap leads to inflation. Image: Richardson Wealth

U.S. Commercial and Industrial Loans Outstanding

U.S. Commercial and Industrial Loans Outstanding Business loan growth is slowing down, despite Fed easing. Currently, liquidity is going into the financial markets, but not into the real economy. Image: Pictet Wealth Management

Leading Indicators Are Improving Globally

Leading Indicators Are Improving Globally Leading economic indicators have been improving throughout 2019. This may suggest that global growth is back on track. Image: Richardson Wealth

S&P 500 Median Daily Return by Year

S&P 500 Median Daily Return by Year Interesting chart showing that the median daily return for some years are lower or higher than expected. The numbers in white show the annual return. Image: Ritholtz Wealth Management LLC

China: Chinese Debt-to-GDP Ratios by Sector

China: Chinese Debt-to-GDP Ratios by Sector The debt-to-GDP ratio of the non-financial corporate sector accounts for the largest share of China’s debt and declined to 143% of GDP. Image: Pictet Wealth Management

S&P 500 and Moving Average

S&P 500 and Moving Average When the 200-day moving average is back above the 400-day moving average, it tends to be bullish for the S&P 500. Image: Commonwealth Financial