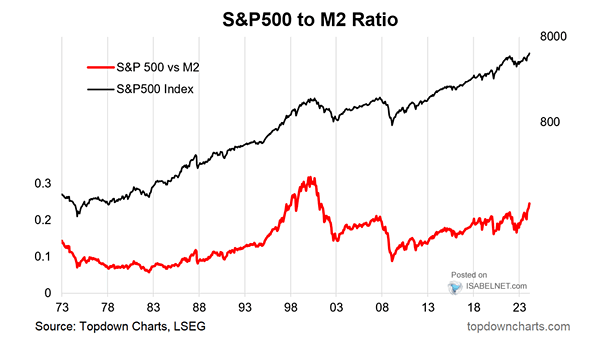
S&P 500 to M2 Ratio

S&P 500 to M2 Ratio The rising S&P 500 to M2 ratio suggests a potential overvaluation in the U.S. stock market. This trend implies greater demand for stocks compared to the supply of money, worrying investors and analysts. Image: Topdown Charts

U.S. 10-Year Real Rate

U.S. 10-Year Real Rate A potential rise in U.S. real rates could cause the collapse of the AI bubble, leading to turbulence in the stock market. Overvalued AI companies facing declines could trigger widespread market instability, eroding investor confidence. Image: BofA Global Investment Strategy

S&P 500 – CAPE Valuations

S&P 500 – CAPE Valuations While a high CAPE ratio can persist for extended periods without triggering a market correction, historical data suggests that such periods of elevated valuations are typically followed by lower stock market returns. Image: Real Investment Advice

S&P 500 Net Long Futures Contracts

S&P 500 Net Long Futures Contracts Despite some profit-taking, asset managers and leveraged funds remain very net long S&P 500 futures, suggesting their positive outlook on the future performance of the U.S. stock market. Image: Deutsche Bank

January’s Historical Returns

January’s Historical Returns Throughout history, the performance of the U.S. stock market in the month of January has often served as a reliable indicator for the overall trajectory of the market for the rest of the year. Image: Real Investment Advice

S&P 500 – Margin Debt vs. Long-Term Trend

S&P 500 – Margin Debt vs. Long-Term Trend A rise in the ratio of margin debt to the S&P 500 market cap could indicate a bullish outlook for the U.S. stock market, potentially signaling confidence in the market’s upward trajectory. Image: Topdown Charts

Valuation – S&P 500 Forward P/E

Valuation – S&P 500 Forward P/E Ratio The valuation of the S&P 500 index tends to expand after the Fed’s first cut, providing valuable insight into the potential impact of the Fed’s decisions on the U.S. stock market. Image: Goldman Sachs Global Investment Research

S&P 500 Realized Volatility During Recession

S&P 500 Realized Volatility During Recession During recessions, there is often increased uncertainty and risk aversion among investors, which can lead to higher levels of volatility in the U.S. stock market. Image: BofA Global Research

S&P 500 Price Returns by Year of Presidential Cycle

S&P 500 Price Returns by Year of Presidential Cycle While the fourth year of the presidential cycle has historically been favorable for the U.S. stock market, it tends to have lower returns compared to the third year. Image: Goldman Sachs Global Investment Research

S&P 500 vs. Its Seasonal Pattern

S&P 500 vs. Its Seasonal Pattern While past performance does not guarantee future results, can the U.S. stock market continue to follow its seasonal pattern? Image: Topdown Charts