Historical S&P 500 December Returns
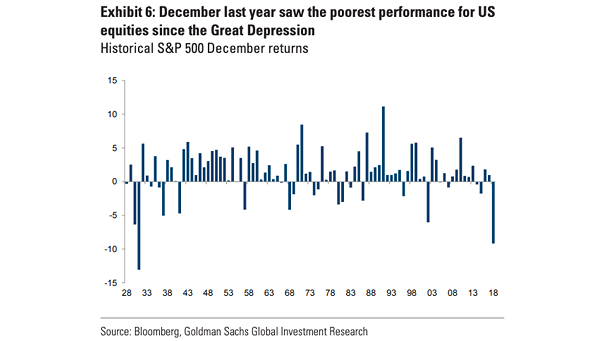
Historical S&P 500 December Returns December 2018 was the worst december for U.S. equities since the Great Depression. Image: Goldman Sachs Global Investment Research
Historical S&P 500 December Returns December 2018 was the worst december for U.S. equities since the Great Depression. Image: Goldman Sachs Global Investment Research
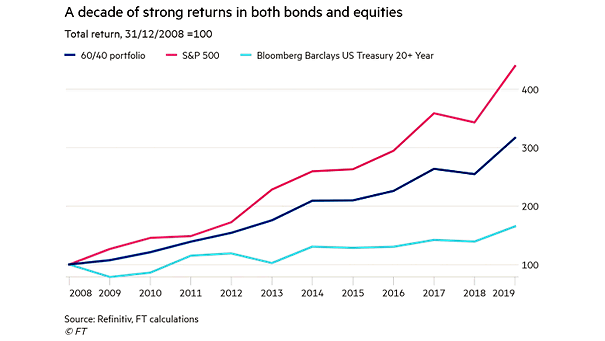
Total Return since 2008: 60/40 Portfolio, S&P 500 and U.S. Treasury 20+ Year The current bull market began 10 years ago, but the next 10 years could be very different. Image: Financial Times

S&P 500 Average Monthly Returns and Pre-election Year Since 1950, and over the past 10 & 20 years, the S&P 500 has been positive on average in December. Image: Ryan Detrick, LPL Financial LLC
Median S&P 500 12-Month Returns Based on Control of U.S. Government A unified government under the Democrats could represent a major risk for the S&P 500 in 2020. Image: Goldman Sachs Global Investment Research
S&P 500 Normalized P/E vs. Subsequent Annualized Returns Chart suggesting annual returns of around 5% over the next 10 years (R² = 0.79). Image: BofA Merrill Lynch US Equity & US Quant Strategy
S&P 500 Index Average Returns After Record Highs Since 1950, the S&P 500 has continued to reach record highs, but rarely in a straight line. Image: LPL Research
S&P 500 Total Return, Adjusted for Inflation, in Three Years After Initial Election The stock market performance, adjusted for inflation, in first three years since Trump’s election is quite good. Image: Bloomberg
S&P 500 First Week of November to Year-End Return Interesting chart suggesting that the return from 11/5 to the end of this year could be around 4%, and the S&P 500 Index above 3,200. Image: Fundstrat Global Advisors, LLC
S&P 500 Index Return and Chinese Calendar Year The year of the Pig seems to be strong for U.S. equities this year. Image: Ryan Detrick, LPL Financial LLC
S&P 500 Valuation and Subsequent Annualized 10-Year Returns Chart suggesting annualized returns of approximately 5% over the next 10 years. Image: BofA Merrill Lynch Global Research
S&P 500 Price Return 12-Month Period Following Midterm Election Since 1946, the S&P 500 has never declined in the 12 months following a midterm election. Image: Strategas