Investor Sentiment – NAAIM Exposure Index and S&P 500
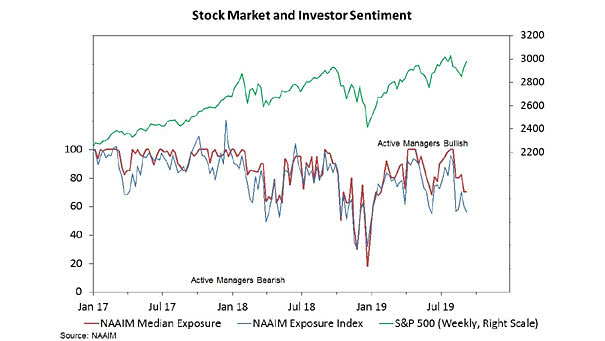
Investor Sentiment – NAAIM Exposure Index and S&P 500 NAAIM Exposure Index dropped to 56.15% (median exposure at 70%). NAAIM members’ optimism was short-lived. Image: Willie Delwiche, Baird
Investor Sentiment – NAAIM Exposure Index and S&P 500 NAAIM Exposure Index dropped to 56.15% (median exposure at 70%). NAAIM members’ optimism was short-lived. Image: Willie Delwiche, Baird
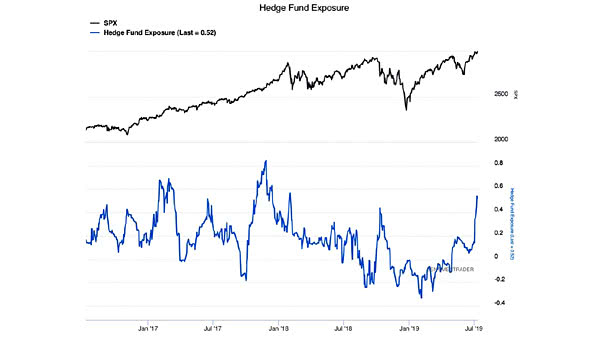
S&P 500 and Hedge Fund Exposure While the S&P 500 is at all-time high, hedge funds increase their exposure to equities (last = 0.52). Image: Sentimentrader

Consolidated Equity Positioning Consolidated equity positioning, currently at the 35th percentile, has steadily increased and is nearing neutral, indicating a gradual shift from defensive to more balanced equity exposure. Image: Deutsche Bank Asset Allocation
Share of Global Market Capitalization The United States’ 64% global equity market share stems from strong corporate earnings, technological innovation, deep capital markets, and global revenue exposure, driving its dominant influence on global finance. Image: Goldman Sachs Global Investment Research
S&P 500 Energy / S&P 500 The energy sector’s current low relative price performance combined with attractive valuations and strong underlying fundamentals makes it a compelling value investment opportunity for investors seeking exposure to this sector. Image: Gavekal, Macrobond
Equity Market Concentration – Market Capitalization of 10 Largest Companies as Share of S&P 500 Total The S&P 500’s top 10 stocks hold a disproportionately large share of the index’s weight relative to their earnings, which amplifies risks tied to volatility, diversification, and sector exposure. Image: Goldman Sachs Global Investment Research
Discretionary vs. Systematic Equity Positioning Discretionary investors are maintaining an underweight stance in equities at the 22nd percentile. Meanwhile, systematic strategies are gradually increasing their equity exposure but remain underweight overall. Image: Deutsche Bank Asset Allocation
CTAs Allocation in Oil Given the current market climate, Commodity Trading Advisors have notably raised their exposure to oil. Image: Deutsche Bank Asset Allocation
Small Cap Equity Positioning With small-cap equity allocations at the 23rd percentile, there is considerable room for increased exposure—especially for investors focused on long-term growth. Image: Deutsche Bank Asset Allocation
S&P 500 Drawdown in DXY Dollar Index The U.S. equity drawdown has caused major losses for non-U.S. investors, as falling stock prices and a weaker dollar combined. This has prompted many to reconsider their currency risk strategies and exposure to U.S. equities. Image: Gavekal, Macrobond
U.S. Household Ownership of Stocks, % of Total Assets The elevated equity exposure of U.S. households, while not an absolute sign of impending market downturns, highlights the necessity for cautious investment decisions and strategic portfolio management. Image: J.P. Morgan