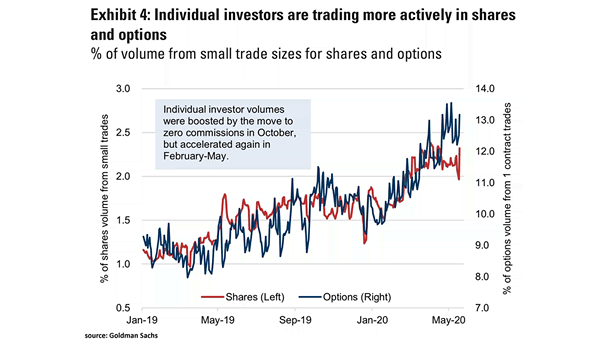
Share of Total U.S. Equity Trading
Share of Total U.S. Equity Trading Are stock pickers an endangered species? Only one-tenth of the US equity market’s trading volumes comes from fundamental equity investors. Image: Financial Times
S&P 500 Trading Volume The decline in trading volume of the S&P 500 could pose risks for investors during the next selloff due to the lack of liquidity. Image: MarketWatch
Percentage of Euro IG Credit Trading in Various Yield Buckets and Negative Yields This chart is another example of negative-yielding debt, which poses major risks for investors. Image: BofA Merrill Lynch
S&P 500 Gains Outside Regular Trading Hours The S&P 500 loves the night, after the market closes. Since 1993, the real profits have come outside regular trading hours. Image: The New York Times, Bespoke Investment Group
Market Share of Algorithmic Trading by Asset Class Algorithmic trading has grown across asset classes, particularly in equities. Image: Goldman Sachs Global Investment Research
Flow – % Share of Rolling One-Month ETF Inflows ETF flows show that investors continue to put their money into large & mid-cap equity funds. Image: Arbor Research & Trading LLC Click the Image to Enlarge
Distressed EM Bonds Distressed emerging market corporate bonds are trading at the Lehman/GFC lows. Image: BofA Global Investment Strategy
CBOE U.S. Put/Call Ratio Composite The U.S. put/call ratio is trading at relatively high levels, which is contrarian bullish. Image: The Daily Shot
Liquidity and Solvency Risk Indices Liquidity and solvency risk indices remain low, which is good news for stocks. Image: Arbor Research & Trading LLC
Large Cap Stocks in Periods of Rising Inflation Are large cap stocks a hedge in periods of rising inflation? Image: Arbor Research & Trading LLC