Conference Board U.S. LEI and 6-Month S&P 500 Forward Return
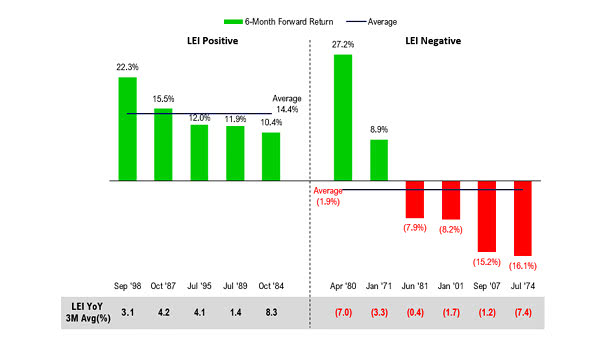
Conference Board U.S. LEI and 6-Month S&P 500 Forward Return A Fed rate cut is good for the S&P 500 when the Conference Board U.S. LEI is positive. Image: Fundstrat Global Advisors, LLC
Conference Board U.S. LEI and 6-Month S&P 500 Forward Return A Fed rate cut is good for the S&P 500 when the Conference Board U.S. LEI is positive. Image: Fundstrat Global Advisors, LLC
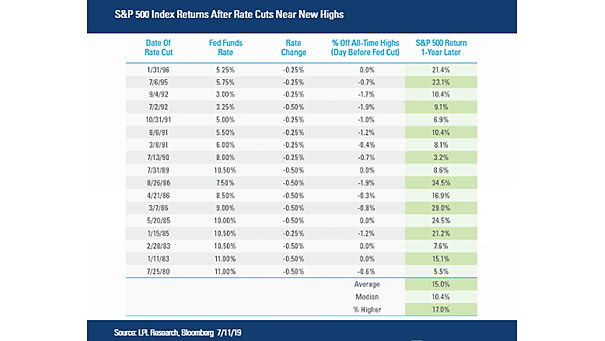
S&P 500 Index Returns After Fed Rate Cuts Near New Highs The adage of “don’t fight the Fed” may be too simplistic, but usually, the market doesn’t care too much about other things, as long as the Fed stays dovish. Image: LPL Research

S&P 500 PE Level vs. Average 12-month Return The chart shows how market valuation affects future equity returns since 1930. You may also like “Why the Stock Market Valuation Matters Before a Recession?“ Image: Richardson Wealth
S&P 500 Sector Returns: Dividends vs. Capital Appreciation Great chart showing the S&P 500 sector returns over the last 25 years. Image: J.P. Morgan Asset Management
S&P 500 Cash Return Yield by Sector and Region Currently, the S&P 500 cash return yield (buybacks + dividends) is 5.2%, the highest since 2011. That’s much more than Europe, Japan and emerging markets. Image: Fundstrat Global Advisors, LLC
Most Important Variables Explaining the S&P 500’s YoY Return Today, the two most important variables explaining the S&P 500’s YoY return: FOMC rate change and U.S. hard economic data. Image: Arbor Research & Trading LLC
ISM Manufacturing Index vs. Average S&P 500 Index Returns An interesting chart showing the ISM Manufacturing Index and the S&P 500 Index forward 12-month return.Low returns when the ISM Manufacturing Index is above 60 and high returns when the ISM Manufacturing Index is below 40. Image: Jeroen Blokland
6-Month Returns for the S&P 500 Index from 1950 to 2018 The next 6 months have been the worst on average. Here is the 6-Month returns for the S&P 500 Index from 1950 to 2018. Our previous two articles: “Sell in May and Go Away?” and “Sell in May and Go Away? Maybe Not this…
S&P 500 Performance After Bear (and Near Bear) Markets End Historically, the S&P 500 has consistently shown a strong rebound and performed well following bear markets. Furthermore, in each new bull market, it has consistently generated positive returns in the second year. Image: Carson Investment Research
S&P 500 Bull Markets The ongoing bull market shows no signs of slowing down. On average, bull markets since 1950 have persisted for nearly five years, delivering an average return of more than 157%. Image: Carson Investment Research