Flow – U.S. Small Cap Stocks
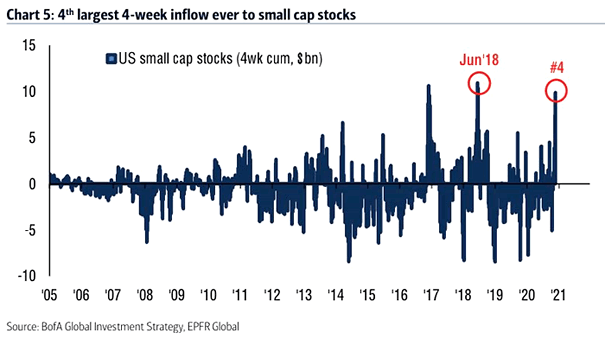
Flow – U.S. Small Cap Stocks U.S. small cap stocks are soaring, as positive news on a COVID-19 vaccine has fueled optimism about an economic recovery next year. Image: BofA Global Investment Strategy
Flow – U.S. Small Cap Stocks U.S. small cap stocks are soaring, as positive news on a COVID-19 vaccine has fueled optimism about an economic recovery next year. Image: BofA Global Investment Strategy
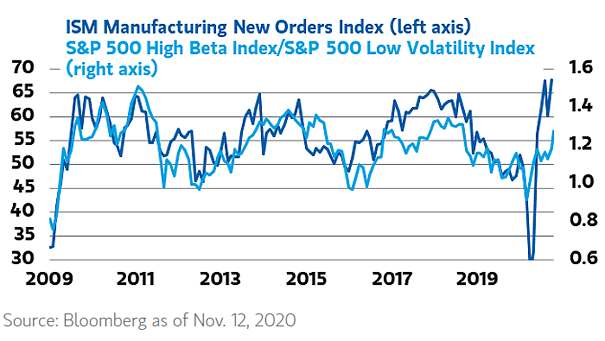
Value Stocks – ISM Manufacturing New Orders Index vs. S&P 500 High Beta Index/S&P 500 Low Volatility Index Value stocks should benefit from an economic rebound, as the ISM Manufacturing New Orders Index is at a 17-year high. Image: Morgan Stanley Wealth Management

U.S. Labor Market – Continuing Claims for Unemployment Continuing claims declined for the sixth straight week, but the U.S. job market remains fragile. Image: Oxford Economics
GDP Indexes – China, U.S., Japan and EU China is experiencing a strong V-shaped economic recovery and is expected to provide a boost to the rest of the world. Image: Gavekal, Macrobond
U.S. Treasury Yields Since 2003 Including U.S. Cycles and Key Trends Chart suggesting that the current move in U.S. Treasuries coincide with the recovery phase of the U.S. economic cycle. Image: Morgan Stanley Research
U.S. 10-Year Treasury Fair Value Adjusted for QE A potential “blue wave” could add fuel to the bear steepening in the U.S. Treasury curve. Image: Oxford Economics
China Real GDP and Industrial Production China is experiencing a strong V-shaped economic recovery from the coronavirus pandemic. Image: BofA Global Investment Strategy
Value Stocks – Russell 2000 vs. Russell 2000 Value Can value stocks bounce back, as Value tends to outperform in the early stages of an economic recovery? Image: Financial Times
Median Cyclicals vs. Defensives YoY Return Since 1990 Cyclicals tend to outperform Defensives during periods of economic strength. Image: Goldman Sachs Global Investment Research
China’s Share in Global Exports With China leading the global economic recovery, China’s exports rose 9.9% YoY. Image: J.P. Morgan
Median Value vs. Growth YoY Return Since 1990 Value tends to outperform Growth in the early stages of an economic recovery. Image: Goldman Sachs Global Investment Research