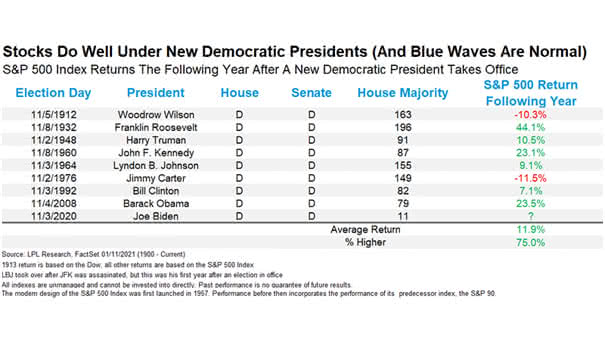
Global Nominal GDP and Corporate Profits

Global Nominal GDP and Corporate Profits This chart shows the correlation and the slowdown in global growth and corporate profits. Historically, margin pressures have preceded the start of recessions. Image: J.P. Morgan

Housing – U.S. Construction Spending and Recessions

Housing – U.S. Construction Spending and Recessions Historically, when the three month moving average turned negative, a U.S. recession occurred within a 12-month period, 7 times out of 9. Image: Pictet Asset Management

University of Michigan Current Economic Conditions Index and Recessions

University of Michigan Current Economic Conditions Index and Recessions This chart shows that historical drops of more than -20 points in consumer confidence current conditions have signaled recessions since 1979. The current drop stands at -15.9 points. Image: Knowledge Leaders Capital

ISM Manufacturing Index and S&P 500 1-Month Return

ISM Manufacturing Index and S&P 500 1-Month Return The current S&P 500 option implied 1-month return distribution is pricing a low probability of a right tail relative to historical realised. Image: Goldman Sachs Global Investment Research

U.S. Long-Term Business Cycle and Recessions

U.S. Long-Term Business Cycle and Recessions This chart suggests that historically, when the U.S. long-term business cycle peaks in the 90th percentile and turns lower, it doesn’t bode well for equities around 4 months later on average. Image: Pictet Asset Management

U.S. Stock Market – Earnings and Valuation

U.S. Stock Market – Earnings and Valuation The valuation is high relative to history, but not near historical extremes. The U.S. stock market should remain under pressure until Q3 earnings season. Image: Fidelity Investments

Different Holders of DM Government Debt

Different Holders of DM Government Debt The chart shows the historical breakdown of different holders of DM government bonds and overall DM debt-to-GDP. Even with QE, central bank government bond holdings are below historical peaks. Image: BlackRock Investment Institute

Risk Parity Funds

Risk Parity Funds Currently, risk parity equity allocations are near the top of the historical range. Image: Deutsche Bank Global Research