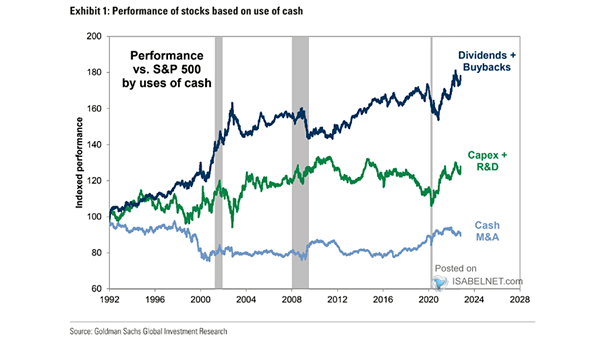
Performance vs. S&P 500 by Uses of Cash
Performance vs. S&P 500 by Uses of Cash U.S. companies that spend the most cash on dividends and buybacks have outperformed the S&P 500 since 1992. Image: Goldman Sachs Global Investment Research
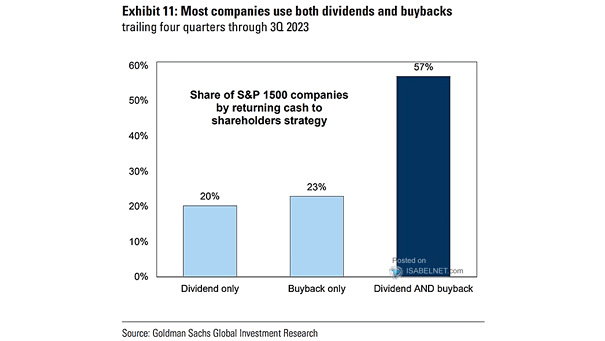
S&P 500 Payout Ratio The S&P 500 payout ratio has gradually declined over time, as S&P 500 companies turn to buybacks. Image: Goldman Sachs Global Investment Research
S&P 500 Cash Return Payout Ratios (% of Net Income) S&P 500 payout ratio is in secular decline, as S&P 500 companies shift to buybacks. Image: Goldman Sachs Global Investment Research
Trading Liquidity in U.S. Equities (for S&P 500) Chart suggesting that the lack of market liquidity may have exacerbated the impact of buybacks on U.S. equities. Image: Societe Generale Cross Asset Research
S&P 500 Operating EPS vs. USA National Income, Corporate Profits Thanks to buybacks, this chart clearly shows the current divergence. Is a new bubble being formed? Image: Nordea and Macrobond
S&P 500 and NIPA Corporate Profits After Tax S&P 500 rose relative to NIPA corporate profits after tax, thanks to buybacks. Image: Morgan Stanley
S&P 500 Payout Ratio Stock buybacks and dividends as a percentage of free cash flow are reaching dangerous levels. Image: MarketWatch
S&P 500 Operating Earnings / NIPA Profits and S&P 500 Returns Interesting chart suggesting that S&P500 2-year returns will be negative, as they were in the late 1990s, when S&P 500 operating earnings rose relative to NIPA profits (thanks to buybacks). Image: Oxford Economics, Macrobond
S&P 500 Cash Return Yield by Sector and Region Currently, the S&P 500 cash return yield (buybacks + dividends) is 5.2%, the highest since 2011. That’s much more than Europe, Japan and emerging markets. Image: Fundstrat Global Advisors, LLC