Monthly Seasonality in the S&P 500 Since 1987
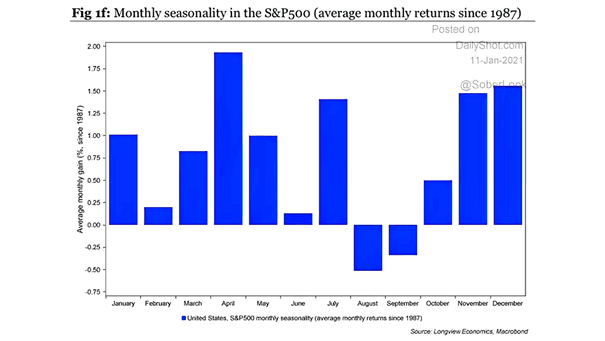
Monthly Seasonality in the S&P 500 Since 1987 Stocks tend to rise in the first month of the year. Image: Longview Economics
Monthly Seasonality in the S&P 500 Since 1987 Stocks tend to rise in the first month of the year. Image: Longview Economics
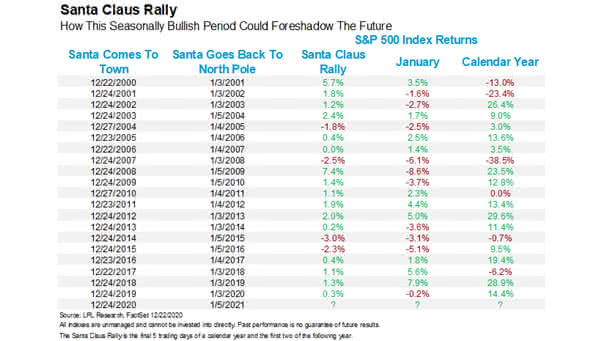
Seasonality – Santa Claus Rally and S&P 500 Returns A bullish Santa Claus rally tends to bode well for January and the full year. Image: LPL Research

Seasonality – S&P 500 Performance in Last 10 Trading Days of a Year: 1945 – 2020 Historically, the last 10 trading days of the year tend to be positive for the U.S. stock market. Image: Bespoke Investment Group
S&P 500 November Seasonality Can investors expect a Thanksgiving rally this year? Image: Goldman Sachs Global Investment Research
Seasonality – Median S&P 500 4Q Return Since 1985 When the S&P500 has returned between 0% to 5% for the first nine months, the median 4Q return has been 9%. Image: Goldman Sachs Global Investment Research
Seasonality – S&P 500 Index – Average Percent Change Each Month – 1928-2020 Historically, September has been challenging for the S&P 500. Image: Yardeni Research
Seasonality – Average of S&P 500 Return Per Calendar Month Historically, August and September have been challenging for the S&P 500. Image: Goldman Sachs Global Investment Research
S&P 500 and 3-Month Seasonality The S&P 500 tends to get a summer rally, as the second strongest 3-month period of the year is June-August, with an average return of 3.05%. Image: BofA Global Research
Seasonality – Median S&P 500 2-Month Returns since 1985 Since 1985, August and September have been the two worst months of the year for the S&P 500. Image: Goldman Sachs Global Investment Research
Seasonality – Average Monthly Total Return for the S&P 500 Index and Statistical Significance Over the past 20 years, July has been positive on average with a high confidence level. Image: Morgan Stanley Research
Seasonality – S&P 500 60-Day Rolling Forward Return On average, July 31 marks the start of the worst 60-day stretch for the S&P 500 since 1990. Image: Morgan Stanley Research