WTI Oil Price and Core PCE Inflation
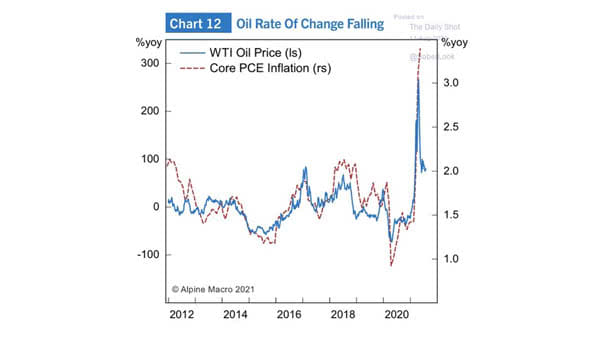
WTI Oil Price and Core PCE Inflation Oil prices tend to be closely linked to inflation. Image: Alpine Macro
WTI Oil Price and Core PCE Inflation Oil prices tend to be closely linked to inflation. Image: Alpine Macro
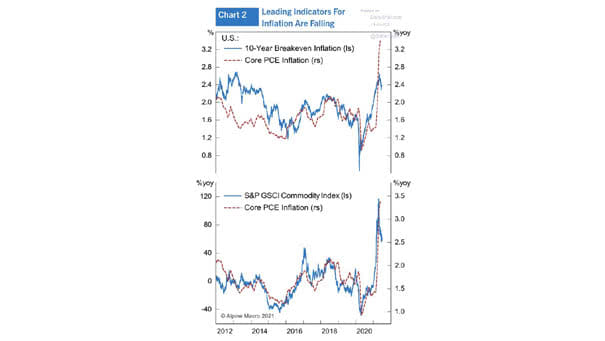
U.S. 10-Year Breakeven Inflation and Core PCE Inflation and Commodities (Leading Indicator) Is the surge in U.S. inflation peaking? Image: Alpine Macro

Inflation – U.S. Core CPI Are there really reasons to worry about U.S. inflation? Image: BCA Research
Inflation – Annualized 3-Month Core CPI Change Has U.S. core inflation peaked? Image: BofA Global Investment Strategy
Inflation – U.S. Core CPI Forecast What impact will rising inflation have on the U.S. stock market? Image: Financial Times
Inflation – U.S. 10-Year Yield and Core CPI Is the rise of inflation temporary, as bond yields are low given current core CPI? Image: Nordea and Macrobond
Inflation – S&P 500 P/E Ratio and U.S. Core CPI The U.S. equity market tends to see multiple compression when inflation gets over 4%. Image: Richardson Wealth
Commodity, ISM Prices and Core PCE Price Index (Inflation) Commodities and manufactured goods tend to lead core inflation. Image: Morgan Stanley Wealth Management
Core PCE Inflation and 5-Year, 5-Year Forward Breakeven Inflation Rate Are inflation expectations too high? Image: Alpine Macro
Core Consumer Price Inflation vs. Velocity of Money There are downside risks to U.S. inflation, as velocity of money tends to lead U.S. core CPI. Image: BCA Research
Inflation – U.S. Core PCE Deflator This chart could suggest more inflation ahead. Image: Alpine Macro