Time Taken for S&P 500 to Correct 10% from Peak
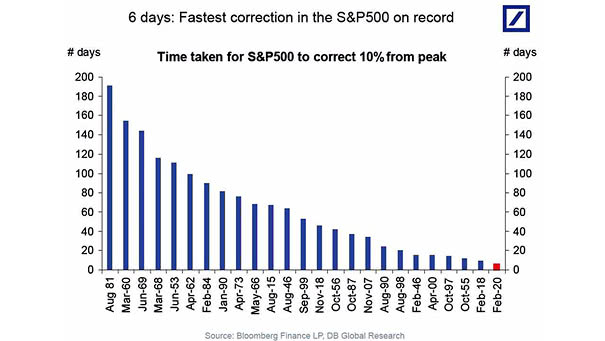
Time Taken for S&P 500 to Correct 10% from Peak The correction over the past six trading sessions is the fastest 10% decline in the S&P500 from a record high. Image: Deutsche Bank Global Research
Time Taken for S&P 500 to Correct 10% from Peak The correction over the past six trading sessions is the fastest 10% decline in the S&P500 from a record high. Image: Deutsche Bank Global Research
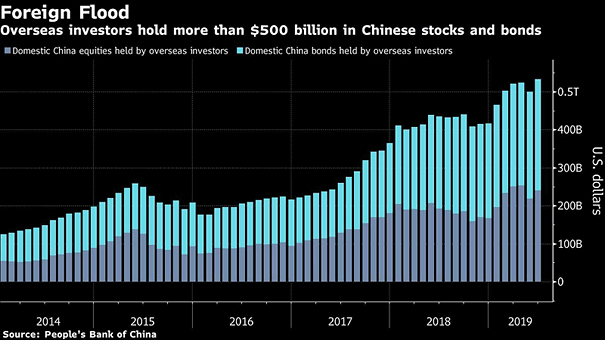
Domestic China Equities and Bonds Held by Overseas Investors Foreign holdings of Chinese equities rose to a record high this year, despite the U.S.-China trade war. Image: Bloomberg

U.S. Household Debt American debt hits a record high of $13.95 trillion and represents about 73% of GDP vs. about 83% a decade ago. Image: Reuters
State and Private Enterprise Default Rate in China The default rate for private Chinese companies has reached a record high at 4.9% vs. 0.6% in 2014. Image: Financial Times
Central Bank Gold Purchases This year, central banks are purchasing gold at record highs, due to geopolitical tensions. Image: Goldman Sachs Global Investment Research
S&P 500 and Fidelity 401(K) Millionaire Accounts The number of 401(k) millionaires hits record high at the end of the third quarter, while the average 401(k) balance is still only $105,200. Image: Sentimentrader
Economic Policy Uncertainty vs. Central Bank Uncertainty Economic policy uncertainty is at record highs, while Central Bank uncertainty is at record lows. Image: BofA Merrill Lynch
Six months ago, the S&P 500 was overvalued by more than 14%… Six months ago, the S&P 500 was overvalued by more than 14% before the market crash, through our advanced stock market valuation model. Near the same level today and within 1% of a record high, the US stock market remains slightly overvalued by 7.8%.…
U.S. Household Equity Ownership vs. S&P 500 While the U.S. equity market has shown remarkable resilience, the record-high household allocations suggest the market is vulnerable to a correction and muted future returns. Image: Real Investment Advice
S&P 500 Stocks Net Call Volume Are investors and traders too optimistic? Megacap growth and tech call buying volume is at its highest level on record. Image: Deutsche Bank Asset Allocation