Financial Stocks vs. Financial Bonds and 5-Year U.S. Treasury Bond
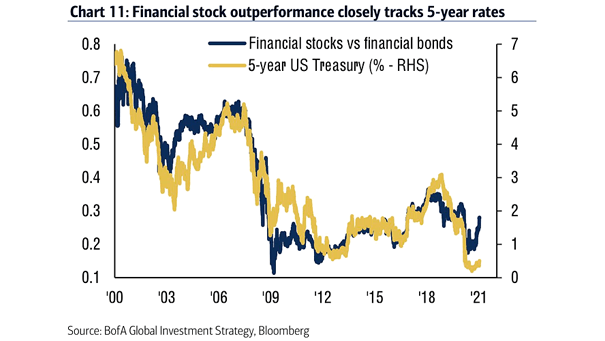
Financial Stocks vs. Financial Bonds and 5-Year U.S. Treasury Bond Financial stock outperformance tends to track 5-year rates. Image: BofA Global Investment Strategy
Financial Stocks vs. Financial Bonds and 5-Year U.S. Treasury Bond Financial stock outperformance tends to track 5-year rates. Image: BofA Global Investment Strategy
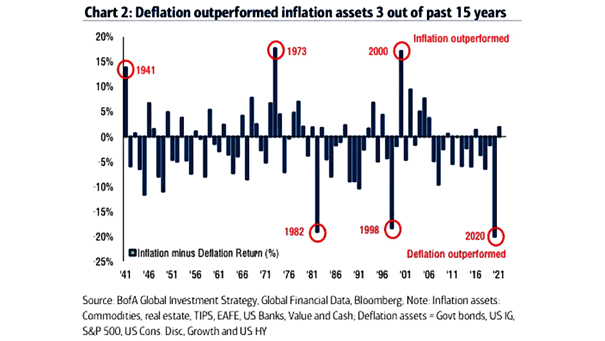
Deflation Assets and Inflation Assets Deflation assets outperformed inflation assets 3 out of past 15 years. Image: BofA Global Investment Strategy

China 10-Year Bond Yield and Shanghai Composite Index China is leading all asset markets. The Shanghai Composite Index could decline with Chinese bond yields as a result of a weaker growing economy. Image: BofA Global Investment Strategy
Growth Stocks – FAANG and S&P 500 Ex-FAANG Price-to-Sales In general, higher rates mean headwind for growth stocks. Image: BofA US Equity & Quant Strategy
Small Cap Stocks – Russell 2000 Total Return Bases on President/Congress Since 1979 Historically, small caps’ highest average returns have been in period of Democratic President with a Democratic Congress. Image: BofA US Equity & Quant Strategy
Performance Small-Cap Stocks – Russell 2000 vs. S&P 500 Relative Total Returns Based on President/Congress Since 1979 Historically, small cap stocks have outperformed large cap stocks in periods of a Democratic President and Democratic Congress. Image: BofA US Equity & Quant Strategy
Price of Gold Since 1790 This chart puts into perspective the price of gold since 1790. Image: BofA Global Investment Strategy
Average U.S. Yield Curve Level and U.S. Recessions The U.S. yield curve is likely to steepen further. Image: Scotiabank GBM Portfolio Strategy
Gold Flows Since 2007 Could gold face a flow headwind over the coming years because of Bitcoin? Image: BofA Global Investment Strategy
2020 Inflows: Equities, Bonds, Cash and Gold There is still a lot of cash on the sideline, which could be put to work in the market. Image: BofA Global Investment Strategy
Inflows as % of Assets Under Management (AUM) Cash, gold and tech are the largest inflows this year, amid the coronavirus pandemic. Image: BofA Global Investment Strategy