U.S. True Money Supply and Nominal GDP Growth
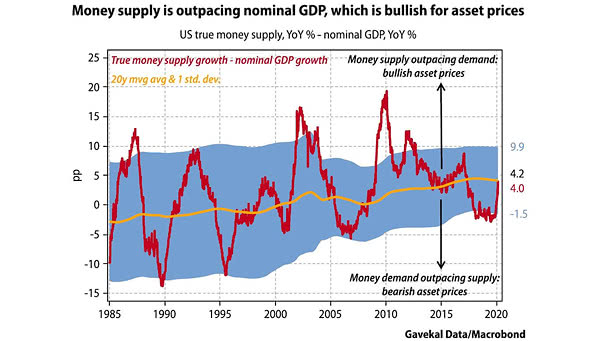
U.S. True Money Supply and Nominal GDP Growth This chart suggests that money supply outpacing U.S. nominal GDP tends to be bullish for asset prices. Image: Gavekal, Macrobond
U.S. True Money Supply and Nominal GDP Growth This chart suggests that money supply outpacing U.S. nominal GDP tends to be bullish for asset prices. Image: Gavekal, Macrobond
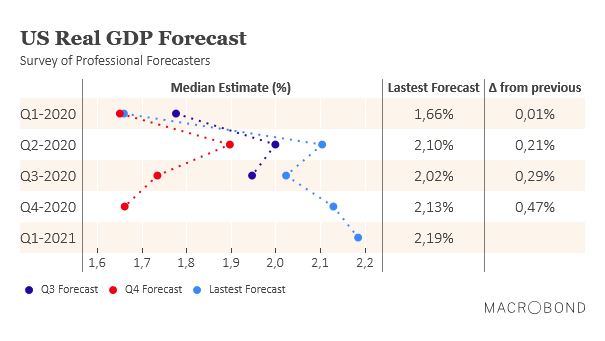
U.S. Real GDP Forecast According to 37 professional forecasters surveyed by the Federal Reserve Bank of Philadelphia, U.S. real GDP is expected to grow 2% in 2020 and should continue to improve next year. Image: Macrobond Financial

U.S. Consumer Credit The current downtrend in US consumer credit impulse could suggest a scenario of slowing growth this year. Image: Macrobond Financial
Tesla vs. The 2000 Internet Bubble While investors are betting on Tesla’s success, this chart is not a prediction on where Tesla stock is heading. Image: Nordea and Macrobond
Are Fears About an Imminent Recession Overblown? Historically, a recession is coming when the Leading Index for the United States is below 1. Today, it stands at 1.37. “The leading index for each state predicts the six-month growth rate of the state’s coincident index. In addition to the coincident index, the models include other variables…
U.S. Non-Manufacturing PMI U.S. Non-Manufacturing PMI is higher than expected and continues to rebound. Image: Macrobond Financial
S&P 500 and ISM Manufacturing Index In recent history, when the ISM Manufacturing Index rose above 50, the S&P500 rose by about 2% on average over the next 3 months Image: Nordea and Macrobond
Inflation – The Rising Cost of U.S. Education and Health Care The costs of health care and education have risen faster than other goods. Image: Gavekal, Macrobond
S&P 500 When ISM Manufacturing Index Rises Above 50 When the ISM Manufacturing Index rises above 50, U.S. Treasuries and the U.S. dollar tend to weaken, while the S&P 500 tends to rise. Image: Nordea and Macrobond
China’s Response to the Spread of the Coronavirus This chart puts the spread of the coronavirus into perspective. Image: Gavekal, Macrobond
U.S. 10-Year Treasury Yield and Viral Outbreaks This chart shows that the impact of previous viral outbreaks (SARS, H1N1, H7N9, Ebola) on U.S. bonds was short-lived. Image: Goldman Sachs Global Investment Research