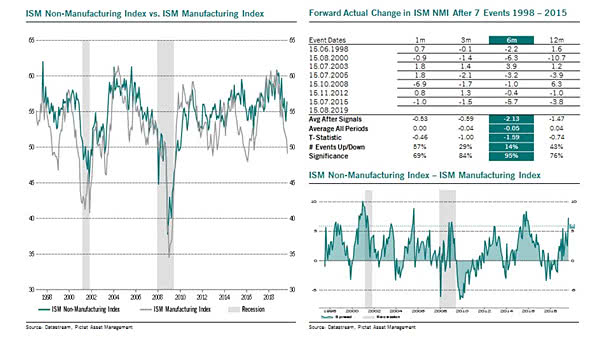
U.S. ISM Non-Manufacturing Index vs. U.S. ISM Manufacturing Index
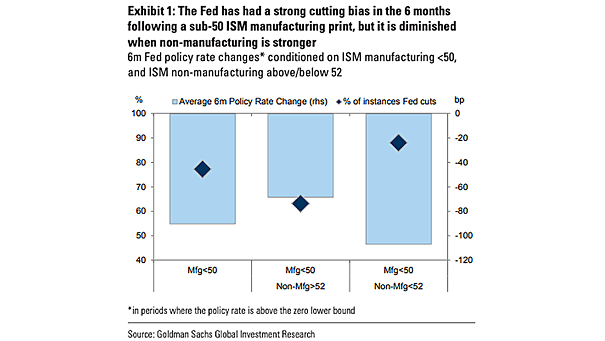
U.S. ISM Non-Manufacturing Index vs. U.S. ISM Manufacturing Index and Recessions Interesting chart showing the spread between the U.S. ISM Non-Manufacturing Index and the U.S. ISM Manufacturing Index over time. Image: Pictet Asset Management