Yield Comparison – S&P 500 Didivend Aristocrats and 10-Year U.S. Treasury
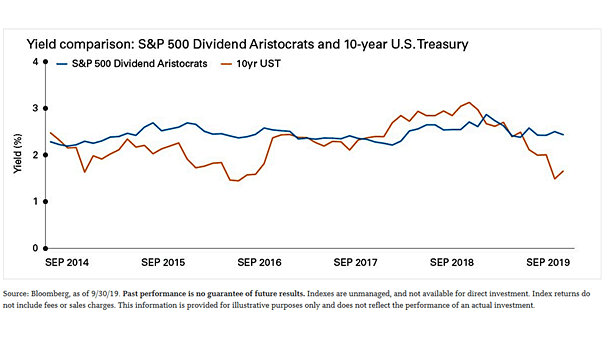
Yield Comparison – S&P 500 Didivend Aristocrats and 10-Year U.S. Treasury S&P 500 dividend aristocrats are once again higher than 10-year U.S. Treasuries. Image: Legg Mason
Yield Comparison – S&P 500 Didivend Aristocrats and 10-Year U.S. Treasury S&P 500 dividend aristocrats are once again higher than 10-year U.S. Treasuries. Image: Legg Mason
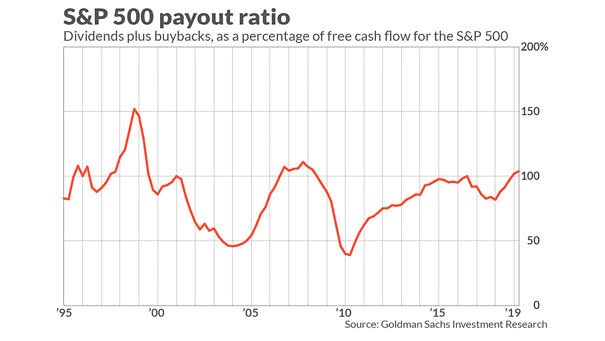
S&P 500 Payout Ratio Stock buybacks and dividends as a percentage of free cash flow are reaching dangerous levels. Image: MarketWatch

S&P 500 Cash Return Yield by Sector and Region Currently, the S&P 500 cash return yield (buybacks + dividends) is 5.2%, the highest since 2011. That’s much more than Europe, Japan and emerging markets. Image: Fundstrat Global Advisors, LLC
Do You Really Think That, By Buying the S&P 500, You Never Lose Money? Well, even if it is not adjusting for inflation with dividends, this chart is very interesting. That’s the reason why we develop stock market forecasting models. Image: Frank Jurs