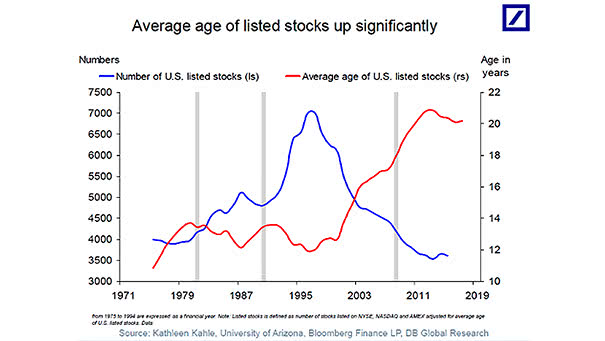
U.S. Monthly Intervention by Currency
U.S. Monthly Intervention by Currency As the chart shows, frequent interventions in the foreign exchange market were fairly common prior to 1995. Image: Goldman Sachs Global Investment Research
Trade War – Probability of a US-China Trade Deal The market-implied probability of a US-China trade deal rises to 40%. Image: Goldman Sachs Global Investment Research
Gold and Negative Yielding Debt This chart shows the strong correlation between gold and market capitalization of global negative yielding debt. Negative global yields are a support for gold.
Major Oil Supply Disruptions As a reminder, disruptions in the oil market have always led to higher oil prices. Image: BofA Merrill Lynch Global Research
Manufacturing’s Share of the U.S. Economy Manufacturing accounts for only 10% of U.S. GDP, but 25% to 45% of the market response. Image: Goldman Sachs Global Investment Research
Trade War – Probability of a US-China Trade Deal The market-implied probability of a US-China trade deal rises to only 19%. Image: Goldman Sachs Global Investment Research
U.S. Stocks with High China Sales and China Stocks with High U.S. Sales US-China trade war affects the relative performance of U.S. and China stocks vs. local market. Image: Goldman Sachs Global Investment Research
Demographics – Dow Jones and Generational Peaks This chart shows that generational peaks are associated with major market tops. GenX peaked in 2018 and Millennials don’t peak until 2038. Image: Fundstrat Global Advisors, LLC
Trade War and Financial Conditions Index The trade war has tightened the Goldman Sachs FCI by about 60bp cumulatively. The Goldman Sachs Financial Conditions Index (FCI) is a weighted sum of a long-term corporate yield, a short-term bond yield, the exchange rate, and a stock market variable. Image: Goldman Sachs Global Investment Research
A Hall of Mirrors in Monetary Policy? This chart suggests a feedback loop between bond market pricing and central bank decisions. Image: Goldman Sachs Global Investment Research
U.S. Equities and The World: Earnings Growth vs. Multiple Expansion Since the 2009 low, the strong performance of the U.S. markets comes from earnings growth (73%) and multiple expansion (27%). You may also like “S&P 500 Return: Earnings Growth vs. Multiple Expansion.” Image: Goldman Sachs Global Investment Research