European IPOs
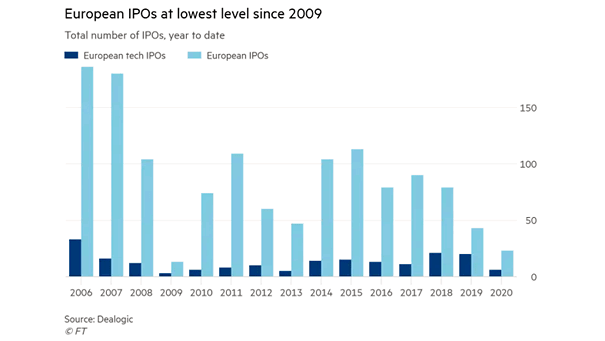
European IPOs This chart highlights the sharp slowdown in European IPO activity. Image: Financial Times
European IPOs This chart highlights the sharp slowdown in European IPO activity. Image: Financial Times
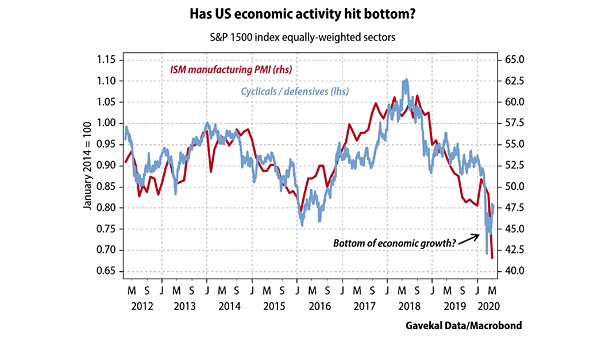
ISM Manufacturing PMI vs. Cyclicals/Defensives The outperformance of U.S. cyclicals could suggest that the U.S. economic activity has bottomed. Image: Gavekal, Macrobond

U.S. Real Personal Consumption Expenditure This chart suggests that U.S. consumer spending activity is expected to decline by 13% in simple terms. Image: Oxford Economics
Revised Real GDP Growth Forecasts for Asian Economies Goldman Sachs slashed growth forecasts for Asian economies, as the coronavirus impacts economic activity. Image: Goldman Sachs Global Investment Research
Emerging Markets Monetary Policy vs. Economic Cycle (Leading Indicator) Chart suggesting that EM monetary policy easing is likely to increase economic activity in the coming months. Image: Topdown Charts
Broad Trade-Weighted U.S. Dollar Forecast Chart suggesting that the U.S. dollar is expected to weaken in 2020, as global economic activity improves. Image: Goldman Sachs Global Investment Research
Debt to Net Worth Ratio for U.S. Households vs. Financial Obligations Ratio Chart suggesting that U.S. household finances are in good shape. This is good news for consumption spending, which accounts for about 70% of all U.S. economic activity. Image: NBF Economics and Strategy
Chinese Credit Growth and OECD Leading Indicator for China Chinese Credit growth rebounded in September and suggests stronger activity on the horizon. The OECD leading indicator for China picked up further at the highest level since 2017. Image: Danske Bank Research
Cass Freight Index and U.S. GDP The Cass Freight Index suggests first signs of manufacturing activity bottoming out. Image: Macronond, SEB X-Asset Research
Cass Freight Shipments Index vs. U.S. GDP The Cass Freight Shipments Index is a relative good predictive indicator of the U.S. economy. It suggests a weakness in U.S. GDP in Q2 2019. The Cass Freight Index is a measure of monthly North American freight activity. You may also like “ISM Manufacturing Index vs. Cass Freight Index.”…
ISM Manufacturing Index vs. Cass Freight Index The Cass Freight Index (white bar chart) is a measure of monthly North American freight activity. It suggests that the ISM Manufacturing Index (green line) could go lower if the U.S. economic slowdown persists. Image: Greg S.