FAQ

FAQ Most Frequent Questions and Answers Membership Why Subscribe? Stay on the top of the US stock market           Isabelnet subscription prepares you for what is ahead with advanced forecasting models.. Exclusive short- and long-term forecasts           Our models alert our members with US market insight no one else have. Keep up to date with…

Basic Membership

BASIC MEMBERSHIP – Click the Images to Enlarge Video tutorials are available by clicking on this link: “FORECASTING MODELS” located in the menu bar at the top of each page. Our daily Stock Market Bull and Bear Indicator is available in the Pro Membership. Upgrade your Basic Membership to a Pro Membership Now! The period of…

Subscribe

BASIC 19.95€/mo 199€/year and save 15% single user 2 Forecasting Models Stock Market Valuation Stock Market Short-Term Forecast Subscribe Now! PREMIUM 29.95€/mo 299€/year and save 15% single user 3 Forecasting Models Stock Market Valuation Stock Market Short-Term Forecast Stock Market Equity Risk Premium Subscribe Now! PRO 39.95€/mo 399€/year and save 15% single user 5 Forecasting…
Home

Advanced Stock Market Forecast 95% Correlation since 1970 Stock Market Valuation Short- and Long-Term Forecasts Bull and Bear Indicator Equity Risk Premium R² = 0.90 since 1970 For Professionals and Individuals View More Subscribe Now! Check out our Stock Market Forecasting Models “Your results are very interesting” Howard Marks Legendary investor Our Features Five Advanced…

Pro Membership Subscription

PRO MEMBERSHIP SUBSCRIPTION 39.95€/mo 399€/year and save 15% single user 5 Forecasting Models Stock Market Valuation Stock Market Short-Term Forecast Stock Market Equity Risk Premium Stock Market Bull and Bear Indicator Stock Market Long-Term Forecast

U.S. Equity Index P/E Valuations vs. History

U.S. Equity Index P/E Valuations vs. History Tech and S&P 500 indexes are trading at premium valuations relative to historical averages. While high valuations may not predict immediate declines, they indicate potentially lower future returns and increased downside risk. Image: Goldman Sachs Global Investment Research

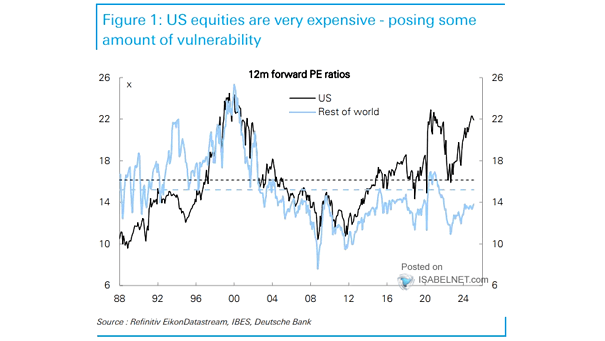
Valuation – Forward 12-Month P/E for S&P 500

Valuation – Forward 12-Month P/E for S&P 500 While U.S. equities are trading at a premium to global stocks, this situation reflects both the strength of the U.S. market and economy. But there are potential risks associated with high valuations and market concentration. Image: Bloomberg

Stock Market Short-Term Forecast

https://www.isabelnet.com/wp-content/uploads/2019/03/stock-market-short-term-forecast.mp4 This great tool shows the US stock market forecast for the next 12 months and the probability This advanced mathematical model extracts insights from multiple financial data and suggests a stock market short-term forecast for the next 12 months with a very high degree of confidence. This great prediction model is updated daily, with…

Terms of Use

Terms and Conditions of Use Welcome to ISABELNET These terms and conditions outline the rules and regulations for the use of ISABELNET’s website. ISABELNET S.A. is located at: 51 Cite Joseph Brebsom, L-4046 Esch-sur-Alzette, GRAND DUCHY OF LUXEMBOURG (LU) (Company Registration Number: B66007) By accessing this website we assume you accept these terms and conditions…