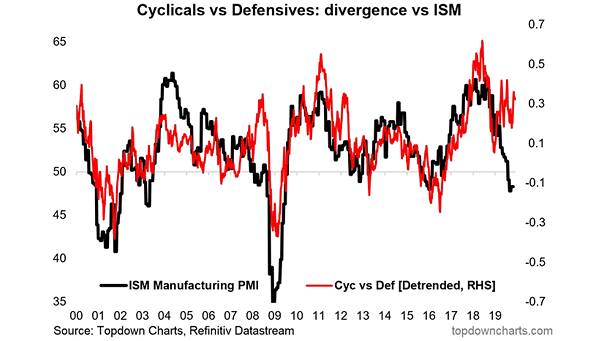
U.S. Cyclicals/Defensives vs. ISM Manufacturing PMI
U.S. Cyclicals/Defensives vs. ISM Manufacturing PMI Chart showing the large divergence between U.S. cyclicals/defensives and the ISM Manufacturing PMI. Eventually, the gap should close soon. Image: Topdown Charts