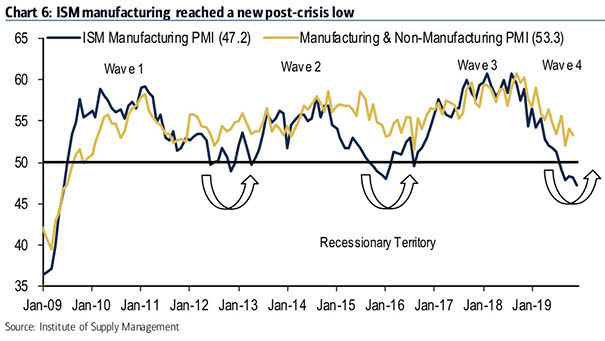
U.S. ISM Manufacturing and Non-Manufacturing PMI
U.S. ISM Manufacturing and Non-Manufacturing PMI Chart suggesting that ISM indices imply a slowdown rather than a recession. Image: BofA Global Research
U.S. ISM Manufacturing and Non-Manufacturing PMI Chart suggesting that ISM indices imply a slowdown rather than a recession. Image: BofA Global Research
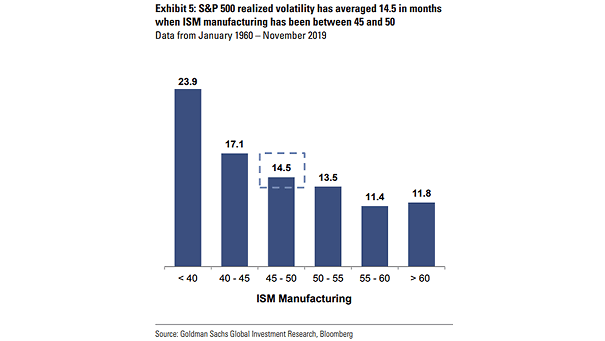
ISM Manufacturing Index and S&P 500 Realized Volatility Interesting chart suggesting the correlation between the S&P 500 realized volatility and the ISM Manufacturing Index. Image: Goldman Sachs Global Investment Research

Stoxx Europe 600 and Europe Manufacturing PMI Is the Europe manufacturing PMI rebound in the cards? European stock markets remain bullish. Image: Goldman Sachs Global Investment Research
Semiconductor Prices and ISM Manufacturing Index Chart suggesting that the surge in semiconductor prices implies ISM Manufacturing Index above 55 in the next 3-months. Image: BofA Merrill Lynch Global Research
200D Change in Yield Curve 30Y-10Y Leads U.S. ISM Manufacturing Index This great chart suggests that 200-Day Change in Yield Curve 30-Year minus 10-Year spread leads U.S. ISM Manufacturing Index by 16 months. It also suggests that U.S. PMI is probably bottoming now and could bounce back. Image: Fundstrat Global Advisors, LLC
China and Taiwan Manufacturing PMI The charts suggest a bottom in the Chinese and Taiwanese cycle in early 2020. Historically, this has been positive for global equities. Image: Danske Bank Research
ISM Manufacturing Index and S&P 500 1-Month Return The current S&P 500 option implied 1-month return distribution is pricing a low probability of a right tail relative to historical realised. Image: Goldman Sachs Global Investment Research
Fed Rate Cut vs. ISM Manufacturing Index and ISM Non-Manufacturing Index Since 1997, when the ISM Manufacturing Index is below 50 and the ISM Non-Manufacturing Index is above 52, the Fed is less aggressive, with about 68bp of easing on average. Image: Goldman Sachs Global Investment Research
U.S. ISM Manufacturing Index and S&P 500 Cyclicals vs. Defensives Chart showing that U.S. cyclicals sectors relative to defensive sectors are still pricing in a strong rebound in growth (R = 0.82). Image: Deutsche Bank Global Research
U.S. ISM Manufacturing Index vs. S&P 500 Chart showing that the S&P 500 continues to price in a strong rebound in the ISM, from 49 to 54 (R = 0.62). Image: Deutsche Bank Global Research
Manufacturing’s Share of the U.S. Economy Manufacturing accounts for only 10% of U.S. GDP, but 25% to 45% of the market response. Image: Goldman Sachs Global Investment Research