For Professionals and Individuals
Advanced Stock Market Forecast
95% Correlation since 1970 Stock Market Valuation Short- and Long-Term Forecasts Bull and Bear Indicator Equity Risk Premium R² = 0.90 since 1970
Our Features
Five Advanced Decision Support Tools
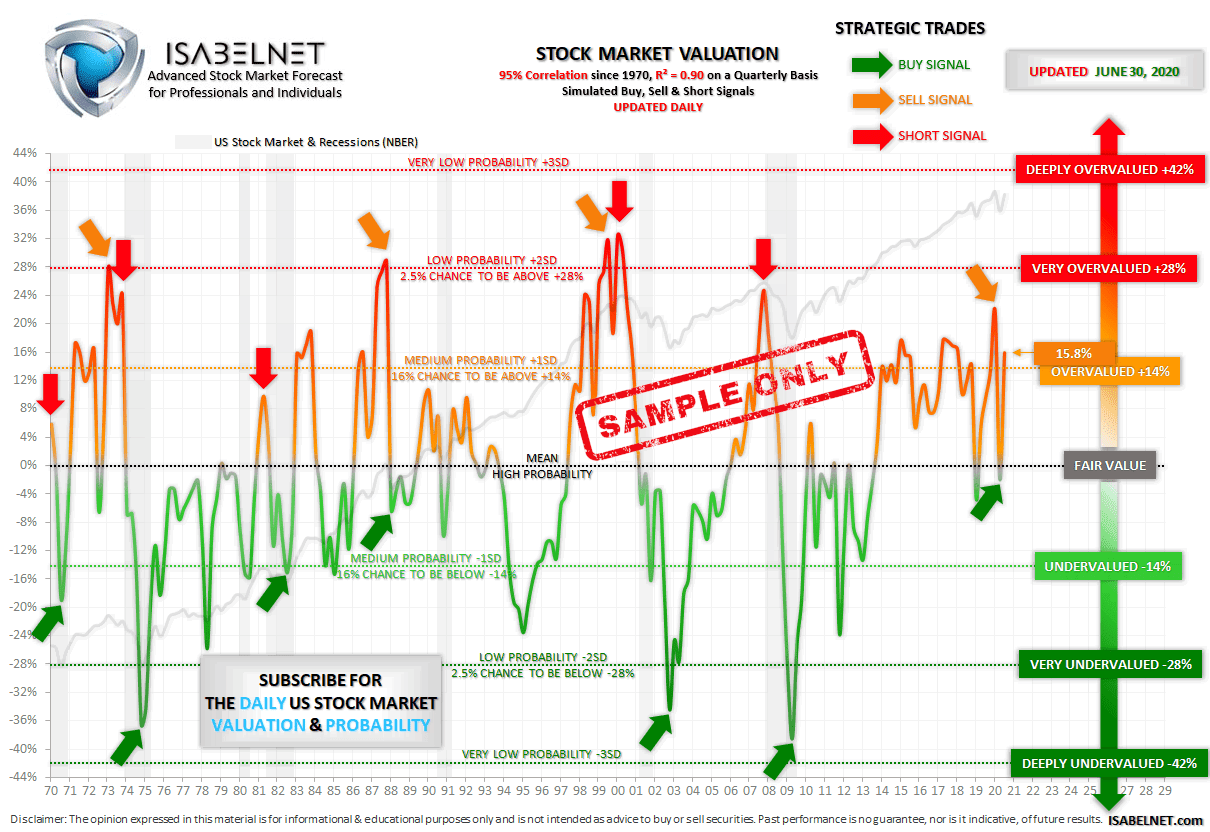
Stock Market Valuation
This powerful model looks into the US stock market and alerts if it is overvalued or undervalued
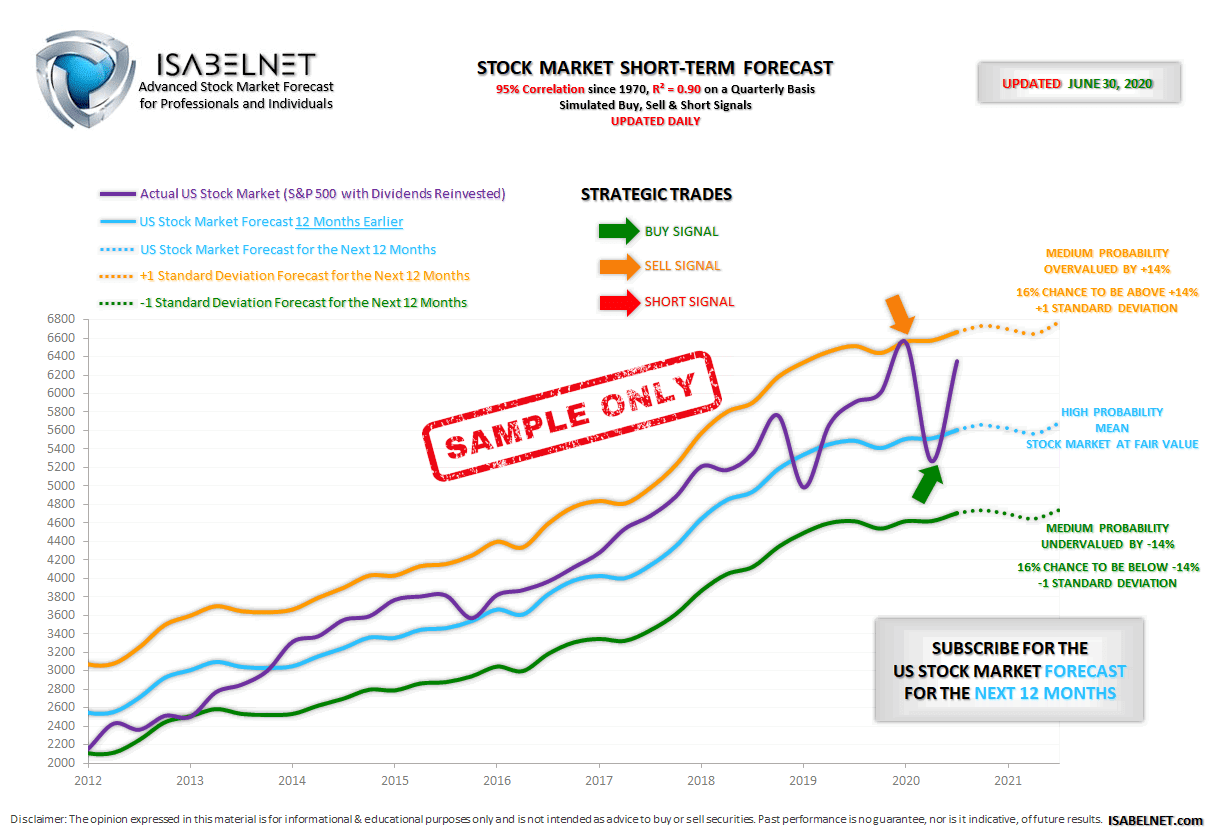
Stock Market Short-Term Forecast
This great tool presents the US stock market forecast for the next 12 months and the probability
Stock Market Equity Risk Premium
This model shows if the US stock market return is more or less attractive for the next 10 years than the 10-year Treasury note
Stock Market Bull and Bear Indicator
This powerful indicator looks into the US stock market and suggests whether it is bullish, bearish or neutral


Stock Market Long-Term Forecast
The long-term forecast model displays the annual and total return expected for the next 10 years and the probability
95% Correlation and R² = 0.90 Since 1970
Based on proprietary algorithms, each forecasting model has a 95% correlation with the US stock market since 1970 on a quarterly basis
Recession Indicators
Empower your knowledge and discover a multitude of recession indicators from our daily blog
Advanced Mathematical Models
Thanks to his computer engineering studies and his stock market experience, the founder has developed these great forecasting models
Proprietary Research
30+ Years of Experience
Customer Service & Privacy
We are committed to providing the best service experience possible. Your privacy is important to us. We don’t rent or sell any personal information
Advanced Forecasting Models
Our mathematical models extract insights from multiple financial data and suggest stock market short- and long-term forecasts. Since 1970, our decision support tools have a fantastic 95% correlation with the US stock market (R² = 0.90)
Private Research in Luxembourg
We have more than 30 years of experience using mathematical formulas, algorithms, statistical and market data. Isabelnet headquarters is based in Luxembourg, a financial center of international renown
Start making your
own smart decisions
Market volatility is blamed for causing people to make ill-timed, impulsive investment choice. Therefore, making the right judgment can be challenging.
To see the whole picture instantly, our forecasting models are great decision support tools based on algorithms, and not on emotional responses. They get insights from multiple financial data and help our members to make better and faster choices by extracting the signal from the noise.

Our Pricing Table
Monthly or Annual Subscription
199€/year and save 15%
single user
2 Forecasting Models
Stock Market Valuation
Stock Market Short-Term Forecast
299€/year and save 15%
single user
3 Forecasting Models
Stock Market Valuation
Stock Market Short-Term Forecast
Stock Market Equity Risk Premium
399€/year and save 15%
single user
5 Forecasting Models
Stock Market Valuation
Stock Market Short-Term Forecast
Stock Market Equity Risk Premium
Stock Market Bull and Bear Indicator
Stock Market Long-Term Forecast
Join our Members
Our members are at the heart of our work!
Choose the membership offer that suits your need
The Basic Membership and the Premium Membership can be upgraded to the Pro Membership any time
Latest Posts
U.S. Stock Market Bull and Bear Indicator – S&P 500
U.S. Stock Market Bull and Bear Indicator – S&P 500 Monday, our Stock Market Bull & Bear Indicator was neutral well before the opening bell and the S&P 500 barely moved, closing down just 0.16%. Using multiple financial data, this great model helps investors navigate through different market conditions. It suggests whether the U.S. stock…
S&P 500 and NAAIM Index Above 97
S&P 500 and NAAIM Index Above 97 Active managers have a habit of chasing rallies and selling near lows. Last week, their equity exposure climbed to 97.13, a level usually seen around short-term market peaks. Image: Real Investment Advice
Contribution to EPS Growth
Contribution to S&P 500 EPS Growth The seven biggest S&P 500 stocks are set to drive 46% of the index’s EPS growth in 2026, down slightly from a 50% share this year as the rest of the market shows signs of catching up. Image: Credit Suisse Research
What Master Investors Say


As Mentionned in...


Among our Advertisers...


