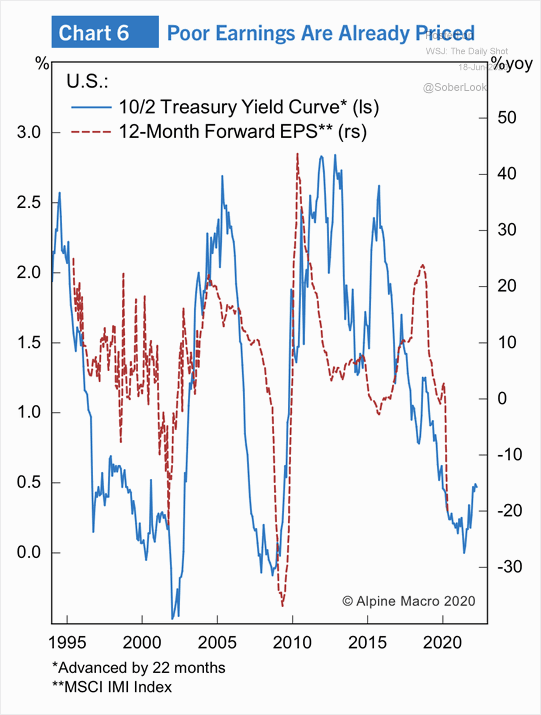
Jun 18 2020 Off 10/2 Treasury Yield Curve vs. 12-Month Forward EPS (Leading Indicator) Chart suggesting that the 10/2 Treasury yield curve tends to lead 12-month forward EPS by 22 months.Image: Alpine Macro