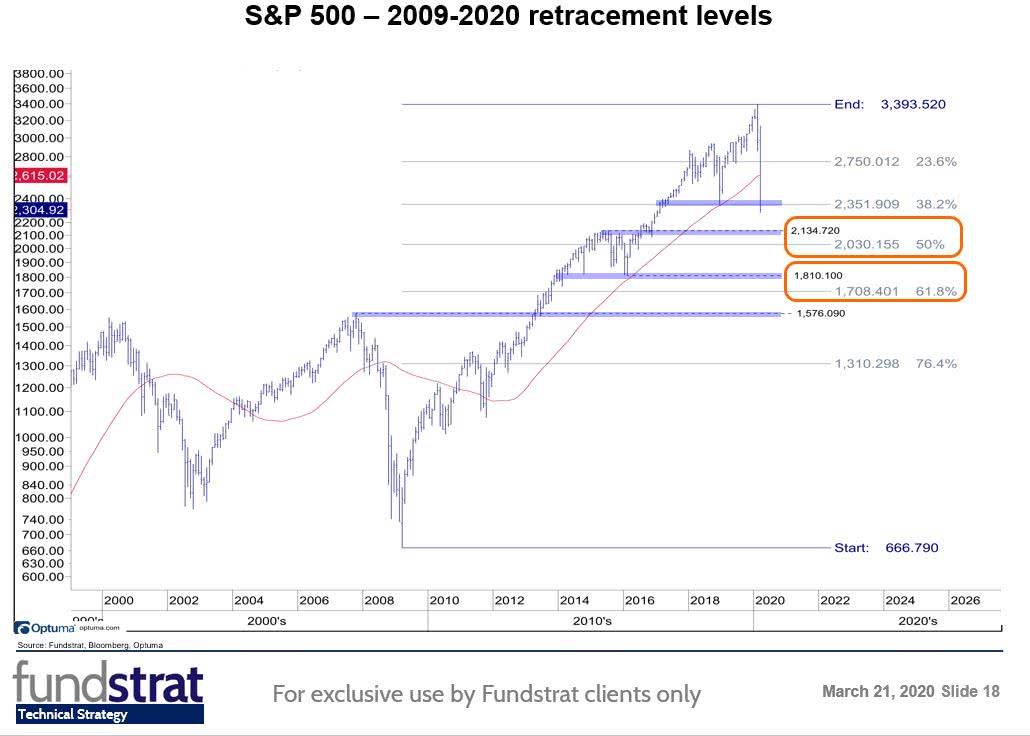
Mar 21 2020 Off S&P 500 - 2009-2020 Retracement Levels This chart shows retracement levels based on the move from the 2009 low to the recent 2020 high.Image: Fundstrat Global Advisors, LLC