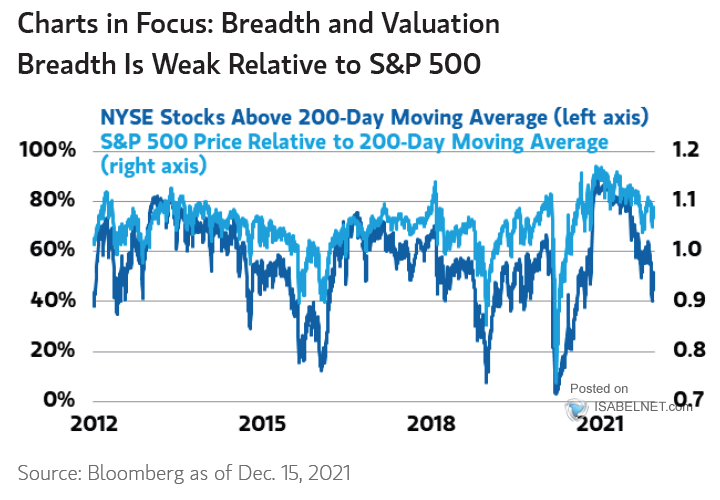
S&P 500 Performance - % Difference vs. the 200-DMA
The S&P 500 is trading about 11% above its 200-day moving average, not far from past peaks. The further it stretches, the more vulnerable it becomes to a consolidation, or a move back toward the average.