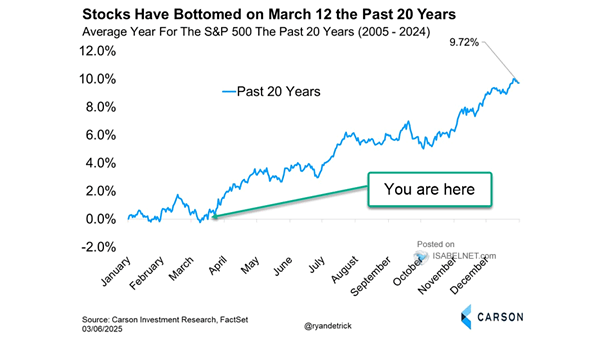
U.S. and Non-U.S. Share Announced Buybacks by Year

U.S. and Non-U.S. Share Announced Buybacks by Year JPMorgan strategists expect further strong growth in buyback volumes, noting that the first eight months of 2025 have already matched last year’s total, providing ongoing support for equity markets. Image: J.P. Morgan

Gold Adjusted for Inflation

Gold Adjusted for Inflation Gold has just surpassed its inflation-adjusted record high from 1980, marking an important milestone as both a hedge against inflation and a gauge of currency weakness. Image: Bloomberg

S&P 500 Use of Cash

S&P 500 Use of Cash The S&P 500’s capex growth in 2025 reflects a broad-based rise, driven by AI-related tech investments and strategic shifts in production and automation, underpinned by expectations of strong returns. Image: Goldman Sachs Global Investment Research

12-Month Forward ROE Ranges for Different MSCI Regions

12-Month Forward ROE Ranges for Different MSCI Regions While a higher ROE indicates stronger profitability that justifies a premium, the overall valuation premium for U.S. equities is also influenced by growth forecasts, risk perceptions, market liquidity, and investor behavior. Image: Goldman Sachs Global Investment Research

Year/Year EPS growth – Magnificent 7 vs. S&P 493

Year/Year EPS growth – Magnificent 7 vs. S&P 493 While mega-cap tech firms are expected to continue delivering above-average earnings growth, the exceptional premium they have maintained compared to the rest of the market is likely to moderate in 2026. Image: Goldman Sachs Global Investment Research

Top 10 Mega Caps and Bottom 440 Stocks

Top 10 Mega Caps and Bottom 440 Stocks In the S&P 500, the top 10 stocks carry so much weight that they impact the index nearly as much as the bottom 440 together, showing how top-heavy it is. Image: Real Investment Advice

Average U.S. 10-Year Treasury Yield Performance in Fed Rate Cut Cycles

Average U.S. 10-Year Treasury Yield Performance in Fed Rate Cut Cycles Fed rate cuts usually push down short-term interest rates, but long-term U.S. Treasury yields do not always move in parallel. Market expectations around inflation, future Fed decisions, and debt supply dynamics can drive them higher instead. Image: Deutsche Bank

Seven Largest Companies as Share of S&P 500 Total Market Capitalization

Seven Largest Companies as Share of S&P 500 Total Market Capitalization The seven largest stocks in the S&P 500 make up 34% of the index’s total market capitalization. Although such a high concentration doesn’t guarantee market declines, it has the potential to increase volatility. Image: Goldman Sachs Global Investment Research

Temporary Help Services Jobs vs. Real GDP and U.S. Recessions

Temporary Help Services Jobs vs. Real GDP and U.S. Recessions Temporary Help Services Jobs stand at -2.91% YoY in August. The relationship between Temporary Help Services jobs and the macroeconomy is complex. Declines in Temporary Help Services Jobs are often considered a leading indicator of a potential recession (red line at -3.5%), but they do…

S&P 500 Buyback Yield

S&P 500 Buyback Yield While S&P 500 share buybacks remain significant, their impact on reducing share counts and boosting returns to shareholders is diminishing compared to past years. Image: Goldman Sachs Global Investment Research

Market-Implied U.S. Recession Probability

Market-Implied U.S. Recession Probability The market-implied probability of a U.S. recession within one year is modestly elevated but not extremely high. Image: Goldman Sachs Global Investment Research