Implied Probability of S&P 500 Drawdown

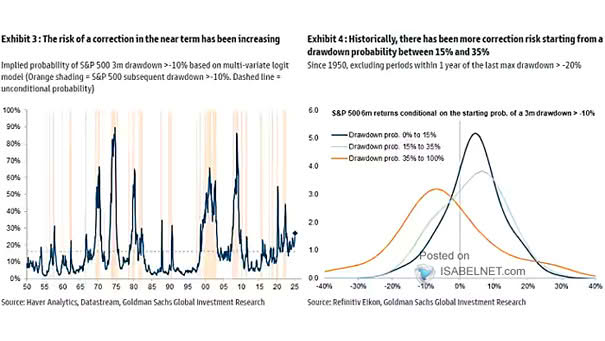
Implied Probability of S&P 500 Drawdown While the macroeconomic environment may still support U.S. equities, Goldman Sachs’ model indicates an increasing risk of a stock market correction in the next 3 months. Image: Goldman Sachs Global Investment Research

S&P 500 Performance When Higher in January and Lower in February

S&P 500 Performance When Higher in January and Lower in February Since 1950, when the S&P 500 has a positive January followed by a negative February, the index tends to finish the year strong, resulting in gains 75% of the time, with a median increase of 10.1% – better than the average year. Image: Carson…

Top Five Companies % of S&P 500 Market Capitalization

Top Five Companies % of S&P 500 Market Capitalization The S&P 500 is experiencing unprecedented levels of concentration. While the concentration presents potential risks, the fundamentals of the top 5 companies remain strong, with elevated profit margins and robust cash flow generation. Image: Deutsche Bank

S&P 500 Days of the Week Returns

S&P 500 Days of the Week Returns In 2025, U.S. stocks have shown a distinct pattern of performance across different trading days of the week, with Mondays and Fridays experiencing struggles while other weekdays have performed well above the historical average. Image: Deutsche Bank

DAX vs. S&P 500

DAX vs. S&P 500 Despite the German economy contracting for the second consecutive year, the DAX has shown impressive performance, highlighting the disconnect between stock market gains and economic realities. Image: Goldman Sachs Global Investment Research

Debt-to-GDP and 10-Year Government Bond Yield

Debt-to-GDP and 10-Year Government Bond Yield While it might seem intuitive that higher debt burdens would lead to higher yields due to increased risk, this relationship has not held true in practice. Yields are influenced by multiple economic factors, not just debt levels. Image: BCA Research

Magnificent Seven Stocks vs. Unprofitable Tech

Magnificent Seven Stocks vs. Unprofitable Tech The Magnificent 7’s market dominance may be waning, at least in the short-term, as unprofitable tech stocks have recently outperformed these tech giants, indicating a broader market expansion. Image: Goldman Sachs Global Investment Research

S&P 500 Performance After an All-Time High and Then Four Red Days in a Row

S&P 500 Performance After an All-Time High and Then Four Red Days in a Row The S&P 500 has fallen for four consecutive days after reaching a record high. Despite short-term challenges, the 12-month outlook remains positive, with positive returns 80% of the time and a median gain of 11.6% since 1990. Image: Carson Investment…

ISABELNET Cartoon of the Day

ISABELNET Cartoon of the Day For bears, the bull market is a recurring nightmare they can’t wake up from. For bulls, it’s just another day of ignoring risk and having a great time! Happy “Hump” Day, Everyone! 🐫🐪😎

Median Stock Short Interest as Share of Market Capitalization

Median Stock Short Interest as Share of Market Capitalization While the S&P 500’s median short interest is currently low by historical standards, Consumer Staples, Utilities, and Health Care sectors are notable exceptions, showing elevated short interest compared to their 30-year historical averages. Image: Goldman Sachs Global Investment Research

Hedge Fund and Mutual Fund Equity Exposure

Hedge Fund and Mutual Fund Equity Exposure In a sign of optimism about the current economic climate, hedge funds and mutual funds have collectively increased their stakes in U.S. equities, which paints a picture of growing confidence in the U.S. stock market. Image: Goldman Sachs Global Investment Research