Citi Economic Surprise Index

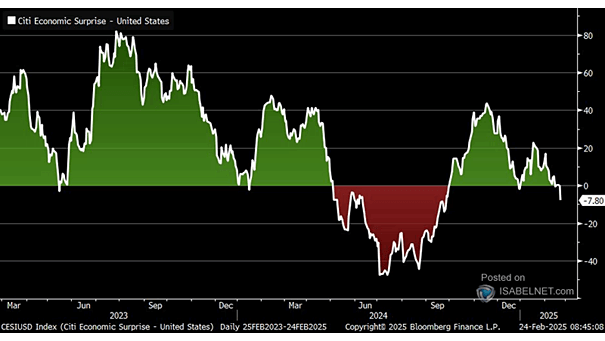
Citi Economic Surprise Index The falling Citi U.S. Economic Surprise Index indicates that economic data is no longer surpassing expectations, but this doesn’t necessarily signal a sudden economic downturn. Image: Bloomberg

S&P 500 Bull Markets

S&P 500 Bull Markets The current bull market, which began in October 2022, is showing potential for continued growth at 28 months old. Historically, bull markets have lasted an average of 5.5 years since 1949, with an average gain of 191.6%. Image: Carson Investment Research

ISABELNET Cartoon of the Day

ISABELNET Cartoon of the Day As the S&P 500 stumbled last week, the bear emerged from hibernation, chainsaw in hand, ready to break the bull market. With a sly grin, it whispered to the bull, “Fully enjoy the bull market… while it lasts!” Have a Great Week, Everyone! 😎

Sentiment – 5-Day Put/Call Volume Ratio

Sentiment – 5-Day Put/Call Volume Ratio The 5-day moving average of the put/call volume ratio has hit its lowest point since late 2021’s bull market peak. Sustained low readings in this ratio often indicate market tops and excessive optimism. Image: Deutsche Bank Asset Allocation

Small-Caps: Upper End of Long-Term Range

Small-Caps: Upper End of Long-Term Range The combination of historical patterns, attractive valuations, and positive earnings growth forecasts suggests that U.S. small-caps may be well-positioned for a period of outperformance in the near future. Image: Fundstrat Global Advisors, LLC

Gold Consecutives Weekly Gains

Gold Consecutives Weekly Gains A perfect storm of factors—including inflation worries, robust central bank purchases, geopolitical uncertainties, and favorable monetary policies—has propelled gold prices upward for eight consecutive weeks. Image: The Daily Shot

Fed Balance Sheet

Fed Balance Sheet Goldman Sachs predicts the Fed will slow its balance sheet reduction in June 2025 and end quantitative tightening by September, which could influence market liquidity and interest rates. Image: Goldman Sachs Global Investment Research

S&P 500 Performance When Higher in January and February

S&P 500 Performance When Higher in January and February When the S&P 500 finishes higher in both January and February, the rest of the year tends to be positive 93.1% of the time, with an average gain of 12.3%, which would likely frustrate those with persistently bearish market views. Image: Carson Investment Research

ISABELNET Cartoon of the Day

ISABELNET Cartoon of the Day Bears hate a strong February, as it is often viewed as a bullish indicator for U.S. stocks. Historically, when the S&P 500 rises in both January and February, it has been a reliable predictor of positive returns for the entire year! Happy Friday, Everyone! 😎

Cumulative Effect of AI Adoption on Productivity Growth

Cumulative Effect of AI Adoption on Productivity Growth The global adoption of AI is expected to significantly boost labor productivity and drive economic growth, potentially leading to substantial increases in GDP. Image: Goldman Sachs Global Investment Research

U.S. GDP Consensus Forecast

U.S. GDP Consensus Forecast The U.S. exceptionalism narrative appears fragile. With expectations already high, there’s little room for positive surprises, and weaker economic data could hurt the dollar due to investors’ skewed positioning. Image: TS Lombard