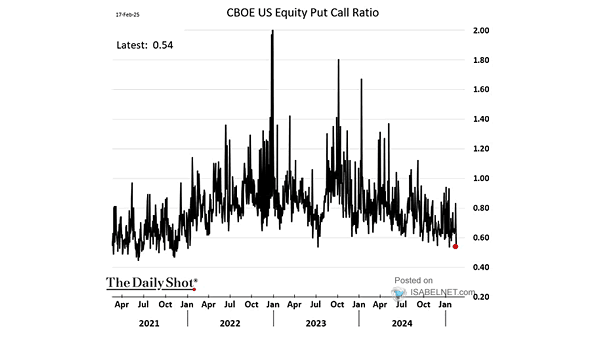
S&P 500 Around Close Presidential U.S. Elections

S&P 500 Around Close Presidential U.S. Elections Election Day frequently serves as a catalyst for the S&P 500, with the index typically surging as political uncertainties give way to clarity. Image: Deutsche Bank

U.S. Election Scenario Probability

U.S. Election Scenario Probability As Republicans gain momentum heading into the U.S. elections, the prospect of their sweeping victory raises both hopes for short-term economic gains and fears of larger deficits and sustained inflationary pressures. Image: Deutsche Bank

MOVE – U.S. Treasury Volatility Index

MOVE – U.S. Treasury Volatility Index The MOVE index, which measures implied volatility in U.S. Treasury options, has surged to its highest level since January 2024, signaling potential shifts in broader financial markets. Image: Bloomberg

Global Fund Flows

Global Fund Flows Cash, equity, and bond funds globally are experiencing significant inflows, indicating a growing confidence in diversified asset allocation strategies. Image: Goldman Sachs Global Investment Research

Percentage of Companies Beating Earnings Estimates by Quarter

Percentage of Companies Beating Earnings Estimates by Quarter S&P 500 companies are experiencing a notable decline in their earnings performance, with the rate of companies beating earnings estimates at its lowest in nearly two years. Image: Bloomberg

S&P 500 EPS Estimates ex-Tech and Communications

S&P 500 EPS Estimates ex-Tech and Communications The S&P 500’s earnings growth is heavily dependent on the technology sector, highlighting the crucial role that tech companies play in driving overall corporate profits in the United States. Image: Bloomberg

U.S. IG Credit Spread

U.S. IG Credit Spread U.S. investment-grade credit spreads have reached their lowest point since 2005, reflecting growing investor sentiment and confidence in future economic conditions. Image: Deutsche Bank

U.S. Federal Debt Growth and Gold Price

U.S. Federal Debt Growth and Gold Price While the increase in U.S. federal debt has traditionally correlated with higher gold prices, multiple other factors significantly influence gold’s market value. Image: Deutsche Bank

Average Year for the S&P 500 during an Election Year

Average Year for the S&P 500 during an Election Year This election year appears to be among the strongest for the S&P 500 so far. Historically, the S&P 500 tends to experience a period of weakness leading up to the U.S. elections, followed by a potential rally towards year-end. Image: Carson Investment Research

Distribution of Forecast 10-Year Annualized S&P 500 Returns

Forecast 10-Year Annualized S&P 500 Returns Based on the 10-year annualized total return forecast distribution, there’s a 72% likelihood that the S&P 500 will underperform Treasury bonds, and a 33% probability that equities will generate returns below inflation. Image: Goldman Sachs Global Investment Research

S&P 500 Performance the Year After a Negative Midterm Year

S&P 500 Performance the Year After a Negative Midterm Year Given that U.S. stocks have consistently performed well in pre-election and election years following a negative midterm year since 1950, investors may have reason to remain optimistic about 2024. Image: Carson Investment Research