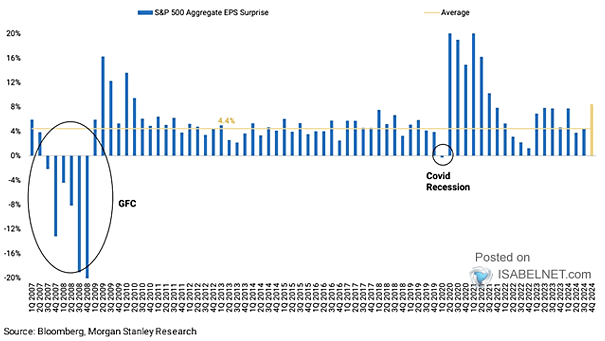
U.S. Bond Yields

U.S. Bond Yields The era of ultra-low interest rates that followed the 2008 financial crisis should be seen as a historical anomaly. It is unlikely that U.S. bond yields will return to their post-crisis lows. Image: Gavekal, Macrobond

U.S. Budget Deficit and Current Account

U.S. Budget Deficit While higher deficits can provide short-term economic stimulus and potentially extend business cycles, they also pose risks to long-term economic stability. Image: Deutsche Bank

S&P 500 Stocks – Average Earnings Day Moves

S&P 500 Stocks – Earnings Day Moves Last quarter set a 15-year record for earnings day volatility, with 12% of S&P 500 stocks experiencing price movements greater than 10%. Image: Goldman Sachs Global Investment Research

U.S. Stocks – Cyclicals vs. Defensives

U.S. Stocks – Cyclicals vs. Defensives Investor sentiment is often reflected in the performance of cyclicals versus defensives. Typically, expectations of economic growth lead to a preference for cyclicals, resulting in their outperformance relative to defensives. Image: Goldman Sachs Global Investment Research

Recession – NFIB Sales Expectations

Recession – NFIB Sales Expectations Optimism among U.S. small business owners regarding future sales has significantly declined, with many anticipating a drop in revenues over the coming months. Image: Real Investment Advice

10-Year Turnover of S&P 500 Constituents

10-Year Turnover of S&P 500 Constituents Over a typical 10-year period, 36% of S&P 500 constituents experience turnover. This level of turnover is significant, highlighting the challenges of tracking long-term performance for individual firms within the index. Image: Goldman Sachs Global Investment Research

Cumulative Advance-Decline Line for the S&P 500 Index

Cumulative Advance-Decline Line for the S&P 500 Index The S&P 500 advance-decline line is a crucial indicator of market trends and sentiment. An all-time high typically indicates favorable news for the U.S. stock market. Image: Morgan Stanley Research

Copper to Gold Ratio and U.S. 10-Year Treasury Yield

Copper to Gold Ratio and U.S. 10-Year Treasury Yield The copper-to-gold ratio is often considered a leading indicator for the direction of the 10-year U.S. Treasury yield under certain market conditions. Image: The Daily Shot

10-Year Annualized S&P 500 Returns

10-Year Annualized S&P 500 Returns Goldman Sachs predicts that the S&P 500 will achieve an average annualized return of only 3% in the coming decade, considerably below historical norms, reflecting concerns about high equity valuations. Image: Goldman Sachs Global Investment Research

Global M2 Liquidity

Global M2 Liquidity The increase in global M2 money supply suggests that liquidity is on the rise, which is likely to stimulate economic activity and push equity markets higher. Image: Morgan Stanley Research

U.S. Corporate Income Tax Rate

U.S. Corporate Income Tax Rate The trend of declining effective tax rates among S&P 500 companies reflects broader economic shifts and policy decisions that have shaped the landscape of corporate taxation in the United States. Image: Goldman Sachs Global Investment Research