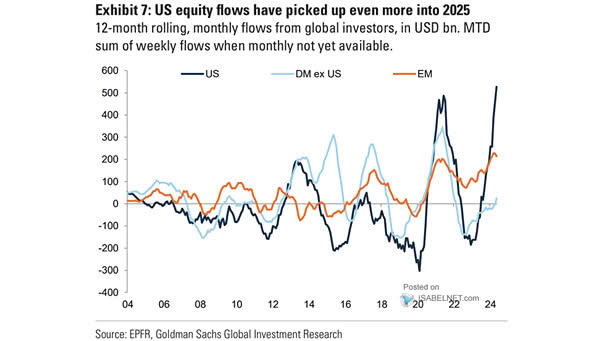
S&P 500 Performance After 6-Week Win Streaks

S&P 500 Performance After 6-Week Win Streaks Since 1950, 6-week win streaks have generally been bullish for U.S. stocks, averaging an 11.1% increase in value one year later, which gives investors strong reasons to expect a positive 2025. Image: Carson Investment Research

S&P 500 and Odds of Winning U.S. Presidential Election

S&P 500 and Odds of Winning U.S. Presidential Election The rising odds for Trump in prediction markets have been closely tied to an upswing in S&P 500 prices, reflecting investor sentiment that aligns with potential changes in economic policy should he win the election. Image: Morgan Stanley Research

S&P 500 Returns After Higher 10 of 11 Months

S&P 500 Returns After Higher 10 of 11 Months Since 1950, when the S&P 500 has been up 10 of the past 11 months using the first signal in a cluster, it has shown a strong tendency to be higher one year later, averaging a gain of 14.7%. Image: Carson Investment Research

Distribution of 10-Year S&P 500 Annualized Returns

Distribution of 10-Year S&P 500 Annualized Returns Goldman Sachs projects a modest average annualized total return of 3% for the S&P 500 over the next decade, considerably below historical averages, reflecting concerns about high equity valuations. Image: Goldman Sachs Global Investment Research

GWIM 4-Week ETF Flows as % of AUM

GWIM 4-Week ETF Flows as % of AUM BofA’s private clients have been buying municipals, dividend, utilities ETFs, and selling energy, EM debt, low-vol ETFs over the past four weeks. Image: BofA Global Investment Strategy

S&P 500 EPS – Potential U.S. Tax Impact on Earnings Per Share

S&P 500 EPS – Potential U.S. Tax Impact on Earnings Per Share Donald Trump’s plan to cut the U.S. corporate tax rate from 21% to 15% could significantly impact S&P 500 earnings per share, potentially increasing EPS by 4% and improving profitability for many companies in the index. Image: BofA US Equity & Quant Strategy

Ranked Cross Asset Returns by Year

Ranked Cross Asset Returns by Year Gold’s remarkable performance in 2024 is largely due to strong central bank purchases, its established reputation as a safe haven during uncertain times, and its effectiveness as an inflation hedge. Image: BofA Global Investment Strategy Click the Image to Enlarge

IG Bond Flows

IG Bond Flows Investment-grade corporate bond funds continue to attract investors, resulting in the biggest 5-week inflow. Image: BofA Global Investment Strategy

Weekly China Flows

China Equity Flows While the initial surge in inflows reflected optimism about China’s economic recovery, subsequent outflows highlight the fragility of market sentiment amidst ongoing economic challenges. Image: BofA Global Investment Strategy

Tech Flows

Tech Flows Tech funds experienced their largest outflow since June 2024, marking a significant shift for the sector that had previously enjoyed positive momentum. Image: BofA Global Investment Strategy

Corporate Clients’ 4-Week Average Buybacks vs. S&P 500 Total Quarterly Buybacks

Corporate Clients’ 4-Week Average Buybacks vs. S&P 500 Total Quarterly Buybacks BofA’s corporate clients are significantly increasing stock buybacks, defying recession fears and indicating a positive market outlook, suggesting these companies expect ongoing growth and stability in the future. Image: BofA Securities