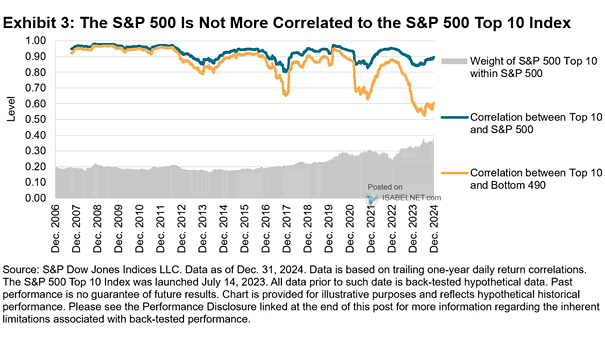
VIX Index and S&P 500 Realized Volatility

VIX Index and S&P 500 Realized Volatility The spread between the VIX and the S&P 10-day realized volatility, when in the 98th percentile, may signal a potential opportunity for U.S. stocks to rally towards the end of the year. Image: BofA Global Research

U.S. Nonfarm Payrolls vs. U.S. ISM Manufacturing PMI

U.S. Nonfarm Payrolls vs. U.S. ISM Manufacturing PMI The U.S. ISM manufacturing index reading below 50 signals a contraction in manufacturing activity, which may impact payroll numbers. However, the relationship between the index and actual payroll figures is not straightforward. Image: BofA Global Investment Strategy

Valuation – MSCI World P/E

MSCI World Fwd PE and EPS Revisions Downward revisions in global EPS raise concerns, suggesting that the global economic landscape is precarious, prompting central banks to adopt more aggressive strategies to stimulate growth. Image: J.P. Morgan

GWIM Debt Holdings as % of AUM

GWIM Debt Holdings as % of AUM Bank of America’s private clients maintain a low debt allocation of 20%, which remains significantly below the average level. Image: BofA Global Investment Strategy

S&P 500 Historical FY2 EPS Revisions vs. Consensus EPS

S&P 500 Historical FY2 EPS Revisions vs. Consensus EPS Recent downward revisions in S&P 500 EPS estimates for 2024-25 reflect a cautious approach from analysts, primarily driven by economic uncertainties. Image: BofA US Equity & Quant Strategy

GWIM Cash Allocation as % Asset Under Management

GWIM Cash Allocation as % Asset Under Management BofA’s private clients have reduced their cash allocation, remaining below the long-term average, while increasing their equity exposure. Image: BofA Global Investment Strategy

S&P 500 and U.S. 2s-10s Yield Curve

S&P 500 and U.S. 2s-10s Yield Curve Since the late 1950s, 10 of the last 12 yield curve steepening cycles have coincided with U.S. recessions, highlighting the yield curve’s effectiveness as a predictor of economic downturns. Image: BofA Global Research

Corporate Client Buybacks as a % of S&P 500 Market Capitalization

Corporate Client Buybacks as a % of S&P 500 Market Capitalization BofA’s corporate clients are currently engaging in significant stock buyback activities, marking an all-time high. This trend is generally perceived as a positive indicator for the broader market. Image: BofA Securities

Real Estate Positioning

Real Estate Positioning Real estate positioning at the 89th percentile indicates strong interest from market participants. Image: Deutsche Bank Asset Allocation

Market – Net Buys by Sector

Market – Net Buys by Sector Last week, ETFs recorded the largest inflows, while the tech sector saw the largest outflows from BofA’s private clients. Image: BofA Securities