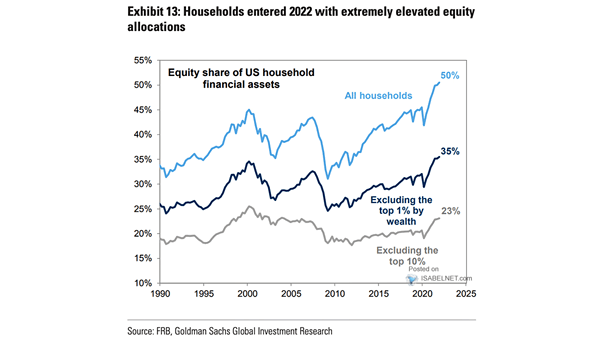
WTI Crude Oil to Gold Ratio

WTI Crude Oil to Gold Ratio Gold shines as the best-performing asset of 2024 for those looking for stability and inflation protection, while oil faces significant challenges from shifting demand patterns. Image: BofA Global Investment Strategy

S&P 500 Monthly Returns and Percentage of Time Up – Presidential Cycle Year 4

S&P 500 Monthly Returns and Percentage of Time Up – Presidential Cycle Year 4 Seasonality provides valuable insights into stock market trends. Historically, after experiencing weaknesses in September and October during election years, the S&P 500 tends to rebound with strong returns in November and December. Image: BofA Global Research

China as % of MSCI ACWI Market Capitalization

China as % of MSCI ACWI Market Capitalization Assuming that China’s market capitalization as a percentage of the MSCI ACWI rises to its 2018 high of 4.0%, this scenario presents a potential upside of approximately 30% for investors. Image: BofA Global Investment Strategy

Number of Global Central Bank Rate Cuts

Number of Global Central Bank Rate Cuts Central banks globally are responding to slowing inflation and the need to stimulate economic growth by cutting interest rates at an unprecedented pace since the COVID-19 pandemic. Image: BofA Global Investment Strategy

High-Yield (HY) Spread USD

High-Yield (HY) Spread USD Goldman Sachs forecasts a favorable high-yield bond market over the next 12 months, anticipating tighter spreads as a result of robust economic conditions and optimistic investor sentiment. Image: Goldman Sachs Global Investment Research

S&P 500 and the 28-Week Williams %R

S&P 500 and the 28-Week Williams %R The Williams %R indicator is an effective tool for identifying overbought and oversold conditions in financial markets. A sustained overbought condition may indicate a healthy market. Image: BofA Global Research

Treasury QT

Treasury QT The current context suggests that QT can continue even as the Fed begins to cut interest rates, provided that these cuts do not push the policy rate below what is considered neutral. Image: Deutsche Bank

S&P 500 YTD Returns as of the End of September in Election Years

S&P 500 YTD Returns as of the End of September in Election Years The S&P 500 has demonstrated a remarkable performance in 2024, marking the best first nine months of an election year since 1950, driven by strong corporate earnings, resilient consumer spending, and investor optimism. Image: Carson Investment Research

Sell Side Consensus Indicator

Sell Side Consensus Indicator The Sell Side Indicator, which tracks Wall Street strategists’ equity allocation recommendations, has remained unchanged in September. The current level suggests that the S&P 500 may see positive gains over the next 12 months. Image: BofA US Equity and Quant Strategy

ETF Gold Holdings

ETF Gold Holdings While gold prices have reached new highs, household investor participation remains low, sharply contrasting with the aggressive buying strategies employed by central banks. Image: BofA Global Research