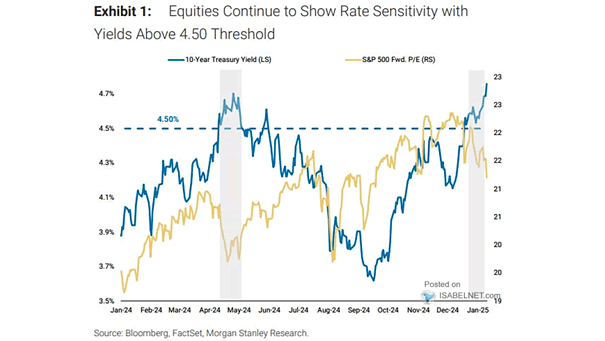
Emerging Market Debt + Equity Flows
Emerging Market Debt + Equity Flows The substantial inflows into emerging market assets highlight a robust interest from investors. Image: BofA Global Investment Strategy
Sector Composition of the S&P 500 by Equity Capitalization The market capitalization of sectors within the S&P 500 reflects the market’s changing landscape, driven by economic conditions and investor sentiment, leading to fluctuations in sector performance over time. Image: Goldman Sachs Global Investment Research
Number of Positive S&P 500 Weekly Performances in the Previous 48 Weeks The recent performance of the S&P 500 has been remarkable. Over the past 48 weeks, the S&P 500 has experienced 34 weeks of gains, which is relatively rare in the market, reflecting strong investor confidence. Image: Deutsche Bank
Cumulative Fund Flows Across Assets Equity and bond funds continue to attract significant inflows. Image: Deutsche Bank Asset Allocation
Commodities Rolling 10-Year Annualized Returns Historically, commodity bull markets have lasted for extended periods, often a decade or more, and have the potential to generate substantial returns for investors who maintain their exposure throughout the cycle. Image: BofA Global Investment Strategy
U.S. Long Term Government Bonds (+15y) Rolling 10-Year Annualized Returns Long-dated U.S. Treasury 10-year returns are currently nearing 62-year lows, raising questions about the potential for better returns in the future. Image: BofA Global Investment Strategy
Money Market Fund Flows In the lead-up to U.S. elections, money market funds, which are seen as a safe haven, frequently see inflows as investors aim to lower their risk exposure. Image: BofA Global Investment Strategy
S&P 500 Index and Fed Funds Effective Rate While Fed rate cuts typically provide a short-term boost to market sentiment, historical trends suggest they often coincide with economic slowdowns. Image: Real Investment Advice
Average Gold Returns After Trading Certain Distances from 200-Day Moving Average Gold is currently 15% above the 200-day moving average, suggesting short-term bullish sentiment. However, historical trends indicate that investors should brace for potentially flat returns in the following 1 to 6 months after such extremes. Image: BofA Global Research
Central Bank Gold Holdings Despite a significant gold price rally, private investors have largely been absent, especially compared to the aggressive purchases made by central banks. Image: Alpine Macro
U.S. Domiciled Mutual Funds While U.S. money market holdings remain historically low, equity allocations are high, reflecting a significant shift in investor behavior towards riskier assets in pursuit of higher returns. Image: Goldman Sachs Global Investment Research