U.S. Stocks – Magnificent Seven Market Value as a Percent of S&P 500 Market Value
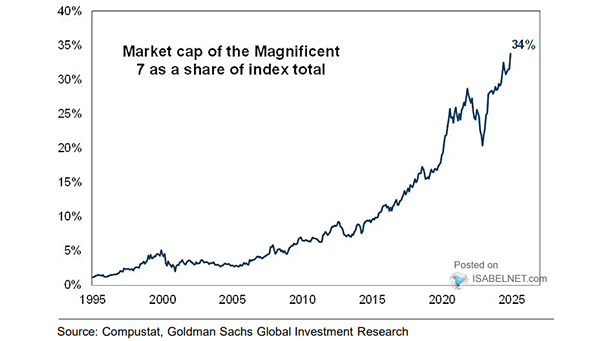
U.S. Stocks – Magnificent Seven Market Value as a Percent of S&P 500 Market Value The “Magnificent Seven” stocks have significantly influenced the S&P 500, now accounting for 34% of its market capitalization, reflecting their dominance and the concentrated risk in the market. Image: Goldman Sachs Global Investment Research