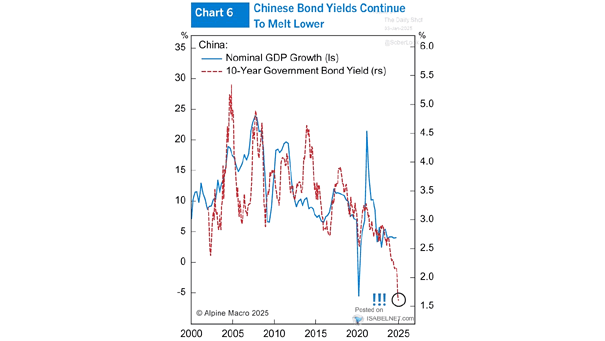
S&P 500 vs. ISM Composite PMI

S&P 500 vs. ISM Composite PMI The divergence between the U.S. ISM Composite PMI and the S&P 500 has become increasingly notable, reflecting contrasting signals about the health of the U.S. economy. Image: Morgan Stanley Research

U.S. Real Prime Rate

U.S. Real Prime Rate The 50bps rate cut helps small businesses by lowering borrowing costs. The Fed’s cut aims to stimulate economic activity and support the growth of these essential companies, which play a crucial role in the overall economy. Image: BofA Global Investment Strategy

Weekly U.S. Equity Fund Flows

Weekly U.S. Equity Fund Flows U.S. equity funds have seen substantial inflows amounting to $31.74 billion, reflecting a strong positive sentiment among investors, particularly following the Fed’s decision to cut interest rates last week. Image: BofA Global Research

Fed Rate Cuts

Fed Rate Cuts Goldman Sachs forecasts a series of 25bp interest rate cuts through mid-2025, aimed at supporting economic growth amid fluctuating inflation rates. Image: Goldman Sachs Global Investment Research

S&P 500 TTM YoY EPS vs. Fed Funds Target

S&P 500 TTM YoY EPS vs. Fed Funds Target Traditionally, when the Fed starts cutting interest rates, corporate profits tend to decelerate. However, this’s not the case today, highlighting the unique economic landscape we face. Image: BofA US Equity & Quant Strategy

U.S. vs. Developed Market Equities (ex-US) Price Relative

U.S. vs. Developed Market Equities (ex-US) Price Relative While there is potential for U.S. equities to maintain their lead in the near term due to strong earnings and market dynamics, historical cycles suggest that this dominance may wane as international markets recover and valuations adjust. Image: BofA Global Investment Strategy

S&P 500 Historical Earnings-per-Share (EPS)

S&P 500 Historical Earnings-per-Share (EPS) The consensus projection suggests that the S&P 500 will achieve 18% EPS growth by the end of 2025, reflecting confidence in corporate profitability as we move into 2025. Image: BofA Global Investment Strategy

U.S. Unemployment Rate

U.S. Unemployment Rate Goldman Sachs forecasts a series of interest rate cuts through mid-2025 while maintaining a steady unemployment rate due to ongoing job growth. Image: Goldman Sachs Global Investment Research

U.S. Breakeven Inflation Rates vs. Oil

U.S. Breakeven Inflation Rates vs. Oil U.S. breakeven inflation rates closely track oil prices, creating a complex challenge for the Federal Reserve as it navigates potential deflationary pressures in the coming months. Image: Real Investment Advice

U.S. Fed Funds Target Rate

U.S. Fed Funds Target Rate While “panic rate cuts” have historically been associated with negative market outcomes, the current context suggests that Wall Street may be embracing these cuts as necessary adjustments rather than signs of economic distress. Image: BofA Global Investment Strategy

Factor Performance Prior and After the First Fed Rate Cut

Factor Performance Prior and After the First Fed Rate Cut Historically, the first rate cuts by the Federal Reserve during easing cycles have tended to favor Growth over Value, Small over Large, and Bonds over Stocks. Image: BofA US Equity & Quant Strategy